Transmission vs ATR FTIR: Choosing the Right Lab Setup
Is slow sample preparation creating a bottleneck in your testing schedule? The core issue often hinges on your choice between ATR vs transmission FTIR.
While modern ATR eliminates pellet pressing for fast solid screening, classical transmission provides the baseline standard for quantitative assays and gas analysis. We broke down the optical mechanics, operating costs, and application fits below to help you configure the right setup for your bench.
Key Takeaways
- Sample Preparation and Speed: ATR evaluates solids, liquids, and intact parts directly in seconds, reaching 40 to 60 samples per hour compared to 5 to 10 for transmission.
- Measurement Depth: Transmission measures the entire interior bulk thickness, whereas ATR evaluates a shallow surface layer (0.5 to 5.0 µm) using an evanescent field.
- Quantitative Accuracy: Transmission provides direct Beer-Lambert linearity for trace assays; ATR requires software correction algorithms to align with transmission reference libraries.
- Application Fit: ATR suits polymers, rubbers, and aqueous fluids; Transmission remains necessary for extractive stack gases and quantitative assays, while USP accepts ATR (<197A>) as a qualitative alternative to traditional KBr pellets (<197K>).
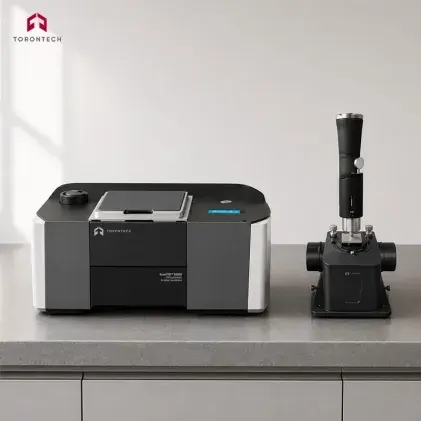
- Optical Hardware: Modular systems like the ToronFTIR™ 7800 support both ATR plates and transmission mounts on a single benchtop platform.
Transmission FTIR Principles
Transmission FTIR is the classical approach to infrared spectroscopy. The optical system directs the infrared beam straight through the prepared sample matrix, and the detector measures the light that emerges on the opposite side.
The analytical physics follows the Beer-Lambert relationship:
A = ε · b · c
(Where A is absorbance, ε is the molar absorptivity coefficient, b is the internal path length, and c is the analyte concentration).
Sample Preparation Methods
Because the infrared beam must traverse the specimen without being completely absorbed or scattered, transmission protocols require detailed sample preparation.
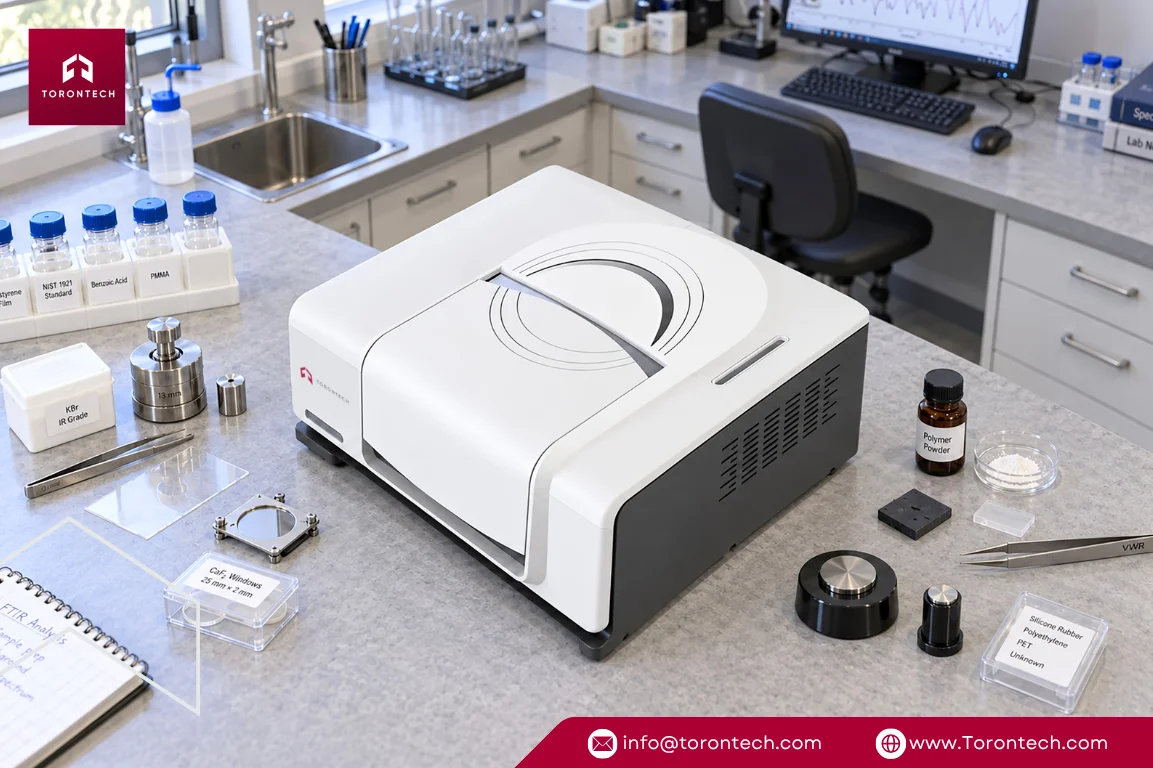
For solid matrices, operators compress the material into a potassium bromide (KBr) pellet by grinding a small quantity of dry analyte with spectroscopic-grade salt and applying hydraulic pressure. Broad-range spectrometers like the ToronFTIR™ 7800 (covering 7,800 to 350 cm⁻¹) frequently utilize transmission mounts to analyze these discs across near- and mid-infrared bands. Alternatively, insoluble solids are ground with mineral oil into a Nujol mull and spread between polished salt plates.
Fluid and vapor matrices require specialized enclosures. Demountable or sealed liquid transmission cells (using CaF₂, BaF₂, or ZnSe optical windows separated by PTFE shims) hold non-aqueous liquids at fixed path lengths.
For aqueous solutions, transmission is restricted to approximately 6 µm path lengths to prevent solvent saturation. Gas-phase analysis relies on sealed glass or metal cells (ranging from ten-centimeter single-pass cylinders to multi-pass mirror chambers spanning several meters) to evaluate dilute vapors.
Advantages and Limitations
Transmission measures the complete interior bulk across the entire specimen thickness (typically 3 to 10 µm for thin sections), bypassing surface-layer variations. It remains the reference benchmark for quantitative calibrations requiring strict Beer-Lambert linearity, matching historical public spectral libraries without mathematical adjustments.
However, in our assessment, the operational friction of transmission FTIR is substantial. Preparing a uniform KBr disc consumes ten to fifteen minutes of technician effort. Solid specimens thicker than 20 microns frequently saturate the detector, causing flat-topped absorption bands that obscure peak ratios.
Furthermore, hygroscopic salt plates (KBr, NaCl) degrade quickly when exposed to ambient humidity, requiring controlled environmental storage.
ATR FTIR Principles
Attenuated Total Reflectance (ATR) has become the primary standard across quality assurance and material identification facilities. In our view, ATR represents a significant operational improvement because it eliminates sample preparation overhead, allowing direct analysis of dry powders, liquids, and solid parts.
ATR operates via total internal reflection. The operator places the sample directly against an internal reflection element (IRE), an optical crystal with a high refractive index (n1).
When the incident beam strikes the internal crystal interface at an angle exceeding the critical angle (θc), it undergoes complete internal reflection. This creates an evanescent wave that extends a fraction of a micron beyond the crystal surface into the sample, where chemical functional groups absorb characteristic frequencies.
Depth of Penetration (dp)
The effective penetration depth (dp) describes the distance from the crystal boundary at which the electric field decays to 1/e (roughly 37%) of its initial value:
dp = λ / [2π · √(n1² · sin²θ - n2²)]
- λ = Wavelength of the mid-infrared light
- θ = Angle of incidence (typically 45°)
- n1 = Refractive index of the ATR crystal plate
- n2 = Refractive index of the sample matrix
Because penetration depth scales directly with wavelength (λ), absorption bands in the 600 to 1000 cm⁻¹ region appear significantly more intense than those in the 3000 to 4000 cm⁻¹ region. Because the evanescent field reaches only 0.5 µm to 5.0 µm into the material, ATR evaluates the outer surface layer rather than the full sample core.
This short path length prevents water absorption bands from saturating the detector, making ATR well-suited for aqueous solutions, bio-fluids, and live cells.
ATR Crystal Selection
Selecting the appropriate optical crystal prevents physical scratching and chemical etching:
| Crystal Material | Refractive Index (n1) | Useful Spectral Cut-off | Scratch Resistance (Mohs) | Chemical pH Range | Recommended Target Applications |
|---|---|---|---|---|---|
| Diamond | 2.40 | ~45 cm⁻¹ (phonon band at 1900–2300 cm⁻¹) | 10 | 1 – 14 | Universal standard. We consider monolithic diamond the most dependable investment. It withstands hard polymers, abrasive minerals, and corrosive acids or bases without scratching. |
| Zinc Selenide (ZnSe) | 2.40 | ~550 cm⁻¹ | 4 | 5 – 9 | Cost-effective routine option. Suitable for neutral liquids, soft polymers, and routine screening. (Warning: soft surface scratches easily. Avoid samples below pH 5, as acidic contact can generate toxic hydrogen selenide [H2Se] gas). |
| Germanium (Ge) | 4.00 | ~600 cm⁻¹ | 6 | 1 – 14 | High-refractive-index materials. Its high n1 limits penetration depth (dp ≈ 0.5 µm). In our view, Germanium is essential for carbon-black-filled elastomers, dark polymers, and bituminous samples to prevent peak distortion. |
Spectral Variations and Correction
A common challenge when comparing ATR vs transmission FTIR is that ATR introduces relative shifts in band intensity and absolute shifts in peak frequency relative to transmission spectra.
Because ATR relies on frequency-dependent attenuated reflectance rather than direct light transmission, peak maxima can shift by several wavenumbers. This displacement can lower match scores during automated library searches, as most commercial databases were collected in transmission mode.
Core Optical Takeaway: Transmission yields an unshifted baseline spectrum suitable for direct database matching. ATR requires mathematical correction algorithms to compensate for wavelength-dependent penetration depth (dp proportional to λ) and anomalous dispersion effects before matching against legacy transmission libraries.
These distortions become pronounced in specific spectral regions and sample matrices. In the far-infrared region, ATR spectra of inorganic pigments exhibit intensity variations and band shifts toward lower frequencies compared with transmission data.
Furthermore, when the angle of incidence approaches the critical angle, anomalous dispersion alters the effective refractive index, causing derivative-shaped peak distortions in high-refractive-index materials.
Despite these physical distortions, published research confirms that ATR spectra are broadly comparable to transmission spectra once mathematical corrections are applied. Modern correction algorithms adjust for wavelength-dependent penetration depth and anomalous dispersion, aligning ATR results with transmission reference data for reliable quantitative analysis.
Technical Comparison
Below is a direct comparison of key analytical attributes between transmission FTIR and ATR-FTIR modes:
| Attribute / Metric | Transmission FTIR | ATR-FTIR |
|---|---|---|
| Sampling Depth | Whole sample thickness (3–10 µm for thin sections) | 0.5–5.0 µm from the surface |
| Sample Preparation | Laborious; requires thin sections, mulls, or KBr pellets | Minimal; dry powder, liquid drops, or direct part clamping |
| Spectral Distortion | Baseline reference standard (no correction needed) | Relative band intensity and peak frequency shifts |
| Water Sensitivity | High; limited to ~6 µm path length for aqueous solutions | Low; avoids solvent saturation; ideal for aqueous samples |
| Spatial Resolution | Standard diffraction-limited resolution | Enhanced spatial resolution due to refractive index of ATR crystal |
| Testing Turnaround | 5 to 15 minutes per prepared sample | 15 to 30 seconds total measurement time |
| Opaque / Carbon-Filled Items | Incompatible due to total beam blockage | Fully functional when paired with a high-index Germanium crystal |
Application Case Studies
Evaluating published research illustrates why sampling depth and matrix structure dictate analytical outcomes when choosing between techniques.
Polymer and Surface Heterogeneity
ATR surface sensitivity can yield misleading conclusions if a sample is not physically uniform. In Styrene-Butadiene-Styrene (SBS) modified asphalt, ATR produced anomalous peak intensity growth because the polymer modifier migrated and concentrated along the exterior surface.
Because transmission measures the full thickness, it avoids this surface-localization artifact. Conversely, for ultra-thin synthetic coatings, ATR can resolve longitudinal optical (LO) modes that remain invisible in standard transmission geometries, provided substrate reflection effects are accounted for during processing.
Biological, Mineral, and Archaeological Samples
In biological classifications, ATR-FTIR outperformed transmission mode when discriminating single-porin Escherichia coli mutants, delivering strain-level classification resolution that transmission could not replicate. For archaeological bone assessment, ATR delivered more consistent data than Diffuse Reflectance (DRIFT) and was comparable to transmission mode, although specific crystallinity indices (IR-SF, C/P) were not directly interchangeable between techniques.
In silicate soil studies, ATR-FTIR provides superior resolution for inorganic matrix vibrations (2000 to 400 cm⁻¹) while showing lower sensitivity for organic fractions, functioning as an effective complement to DRIFT and Photoacoustic (FTIR-PAS) methods.
Application Selection Guide
We view these two sampling configurations as complementary methods addressing different laboratory testing requirements across North American industrial and regulatory settings.
Quick Selection Reference:
- Select ATR When: Running high-volume QA/QC lines, inspecting intact solid rubbers and plastics, analyzing water-based solutions or live cells, or screening viscous resins and pastes without solvent preparation.
- Select Transmission When: Quantifying trace stack emissions and VOC gases, establishing high-precision quantitative assays, evaluating microtomed optical slices, or adhering to legacy monographs that specify direct transmission comparison.
- Select Reflectance (DRIFT or Specular) When: Evaluating loose catalytic powders that cannot withstand hydraulic pellet pressing, or inspecting thin coatings on reflective metallic substrates without applying mechanical clamp pressure.
Polymers and Elastomers
Crosslinked rubbers and engineering thermoplastics cannot be easily ground or dissolved for KBr pellet preparation. In our opinion, attempting transmission on dense polymer blocks creates unnecessary labor costs. With a diamond or germanium ATR module, operators place an O-ring, plastic pellet, or multilayer packaging film directly onto the crystal surface for immediate scanning.
Across the Great Lakes manufacturing corridor (covering industrial centers in Ontario, Michigan, and Ohio), Tier-1 automotive and aerospace component suppliers routinely rely on ATR configurations to inspect incoming raw materials.
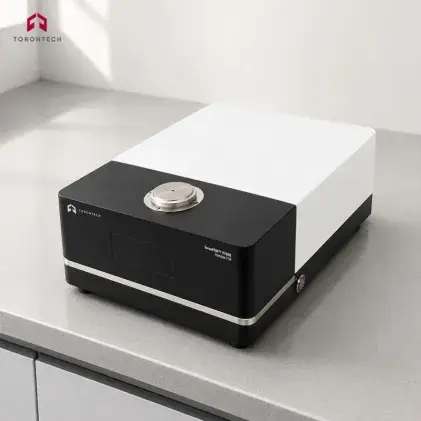
Dedicated instruments like the ToronFTIR™ R4000 (operating across 4,000 to 400 cm⁻¹) feature built-in spectral libraries that identify base elastomer formulations (such as EPDM, fluoroelastomers, and nitriles) and detect plasticizers or additives in seconds.
Quantitative and Compendial Assays
When establishing high-precision calibration curves for active pharmaceutical ingredients or tracking low-concentration chemical impurities in solvents, transmission remains our primary recommendation. Because ATR penetration depth varies with frequency, direct quantitative concentration measurements require strict calibration models. Fixed-pathlength liquid cells equipped with PTFE spacers provide the optical path repeatability required for strict Beer-Lambert calculations.
In major North American pharmaceutical manufacturing centers (such as New Jersey, Massachusetts, and the Greater Toronto Area), regulatory monographs govern this choice. For instance, United States Pharmacopeia (USP) <197> (Spectroscopic Identification Tests) historically specified KBr pellet transmission (USP <197K>).
Today, facilities are transitioning to ATR (USP <197A>) under US FDA and Health Canada GMP frameworks to accelerate lot-release verification. Under USP rules, <197A> is accepted for qualitative identification provided the official Reference Standard is tested using the exact same ATR technique, since an ATR sample spectrum cannot be directly matched against a transmission reference standard.
Lubricant and Fuel Analysis
ATR provides rapid condition screening of used industrial oils, detecting soot buildup, oxidation, and free water within 30 seconds. Conversely, transmission flow-through cell systems remain standard in centralized condition monitoring facilities operating under standardized methods such as ASTM E2412 for in-service lubricant trend analysis, or EN 14078 for quantifying fatty acid methyl ester (FAME) content in biodiesel fuel blends.
For heavy equipment fleets in the Western Canadian energy and mining sectors (such as the Alberta oil sands and Northern Ontario operations), routine ASTM E2412 condition monitoring catches soot loading and glycol contamination early, preventing costly machinery breakdowns in sub-zero working environments.
Gas and Emission Analysis
Because gas-phase molecules have low physical densities, a shallow evanescent wave cannot interact with enough sample volume to generate sufficient optical absorbance. Evaluating volatile organic compounds (VOCs) and industrial emissions requires long-pathlength multi-pass transmission gas cells.
To satisfy regulatory reporting mandated by the US EPA (under EPA Method 320), Environment and Climate Change Canada (ECCC), and ASTM D6348 (the standard test method for extractive FTIR gas analysis), specialized transmission analyzers are required.
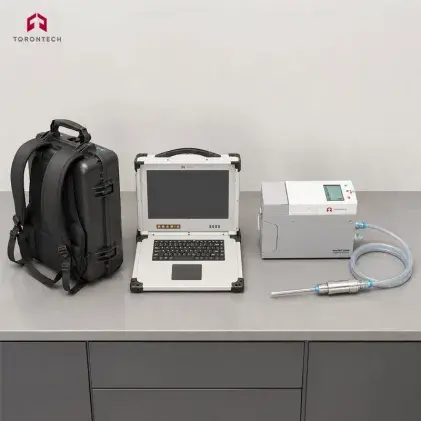
Portable extractive systems like the ToronFTIR™ G12000 (covering 600 to 4,500 cm⁻¹) utilize these optical transmission paths to measure more than 50 gas species simultaneously in hot, corrosive flue gas streams.
Economics and Maintenance
When reviewing transmission vs ATR FTIR, we frequently observe procurement teams focusing solely on upfront hardware capital while overlooking technician labor overhead, sample backlogs, and recurring consumable expenses.
Throughput and Labor Costs
The difference in testing capacity between modalities is dramatic. Weighing spectroscopic salt, grinding compounds, operating hydraulic presses, and cleaning demountable liquid cells restricts transmission testing output to roughly 5 to 10 completed samples per hour.
In contrast, placing an intact sample directly on an ATR crystal followed by a quick solvent wipe enables 40 to 60 completed runs per hour. For high-capacity quality assurance laboratories processing dozens of batches per shift, the labor savings of ATR justify the initial accessory investment within a few months.
Consumable Expenses
Facilities relying exclusively on transmission protocols spend between $1,500 and $4,000 annually on recurring consumables, including spectroscopic-grade KBr powder, replacement hydraulic pellet dies, spare NaCl and KBr optical windows, cell spacers, and polishing slurries.
A solid diamond ATR module requires virtually no replacement parts. Beyond standard lab cleaning solvents and non-abrasive wipes, the ongoing operational cost per test remains negligible.
Maintenance and Optical Care
Daily maintenance requirements also diverge significantly between techniques:
- ATR Crystal Maintenance: After each scan, clean the crystal using a non-abrasive optical wipe moistened with an appropriate solvent (isopropanol for routine films, hexane for heavy greases, or deionized water for salts), followed by a quick background spectrum verification.
- Transmission Plate Maintenance: KBr and NaCl windows are hygroscopic and absorb moisture from ambient air, resulting in optical clouding. They must be stored in heated desiccator cabinets, and fogged windows require manual repolishing with specialized lapping plates to restore baseline transmission.
Hardware Configurations
Because analytical testing requirements change over time, we advise facilities against limiting themselves to a single sampling format. A testing facility may run dozens of routine ATR raw-material verifications during morning shifts, yet require transmission fixtures in the afternoon for specialized compendial compliance.
Benchtop Systems
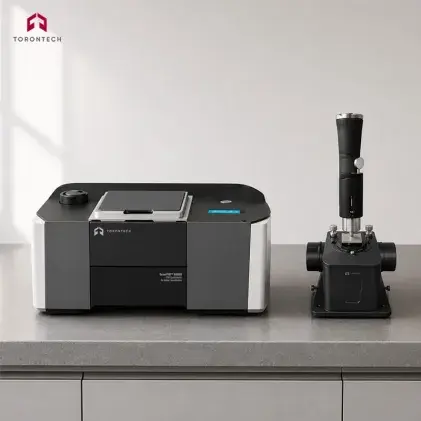
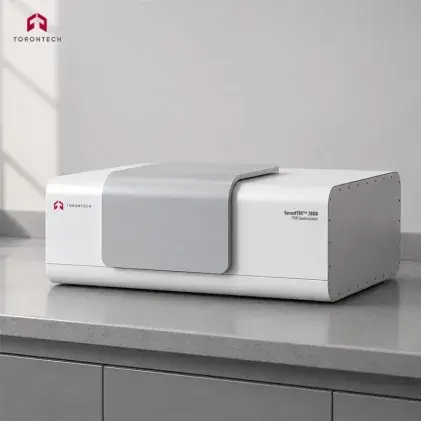
Spectrometers such as the ToronFTIR™ 7800 provide expansive sample compartments that support interchangeable single-reflection diamond ATR modules, specular reflectance fixtures, and standard transmission pellet holders across a broad 7,800 to 350 cm⁻¹ range. This allows analytical teams to switch from KBr transmission research to high-speed polymer ATR testing on a single platform.
Portable Systems
For testing teams moving analysis between pilot plants, warehouse docks, and quality benches, the ToronFTIR™ P7800 packages the complete 7,800 to 350 cm⁻¹ benchtop optical platform into a transportable chassis. It delivers laboratory-grade analytical performance directly to the production floor without sacrificing optical resolution.
Handheld Analyzers
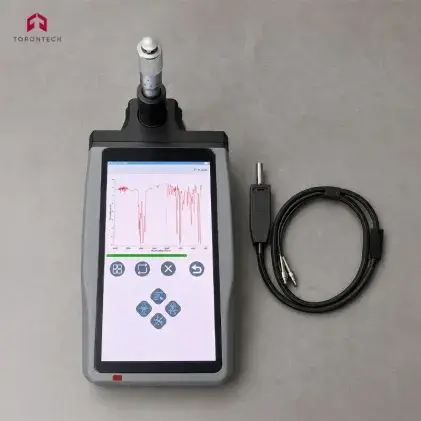
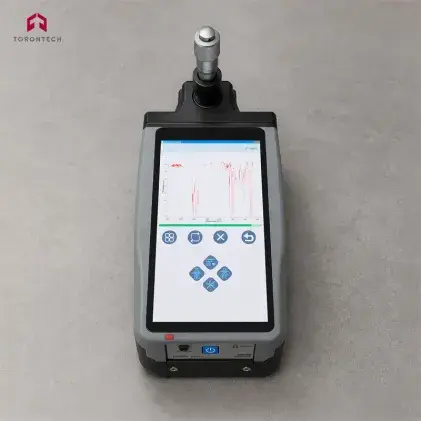
When testing cannot wait for sample delivery to a central lab, dedicated handheld units like the ToronFTIR™ H7800A (7,800 to 650 cm⁻¹) allow direct ATR material verification on site.
For point-of-entry inspection agencies (such as US Customs and Border Protection or the Canada Border Services Agency) and emergency HAZMAT teams, dual-sensor platforms like the ToronFTIR™ H7800M pair infrared ATR (7,800 to 550 cm⁻¹) with Raman spectroscopy (4,000 to 170 cm⁻¹) to identify unknown narcotics, synthetic opioids, and hazardous chemicals directly through transparent packaging.
Instrument Selection
Balancing ATR vs transmission FTIR comes down to matching optical physics to your testing volume: ATR provides rapid turnaround for solid materials and aqueous screening, while transmission remains essential for gas streams and strict quantitative calibrations.
At Torontech, we deliver cost-effective solutions and innovative technologies for quality control and research facilities worldwide. Our complete portfolio of FTIR Spectrometers spans high-resolution benchtop systems, dedicated polymer analyzers, portable field units, and extractive gas analyzers.
Ready to configure the ideal FTIR setup for your facility? Explore our Torontech FTIR Spectrometers or contact our technical engineering team today for expert guidance on sample matrices, daily volume, and compliance targets.
References (Click to expand)
- Beasley, M., Bartelink, E., Taylor, L., & Miller, R. M. (2014). Comparison of transmission FTIR, ATR, and DRIFT spectra: implications for assessment of bone bioapatite diagenesis. Journal of Archaeological Science, 46, 16-22.
- Chan, K. A. L., & Kazarian, S. (2016). Attenuated total reflection Fourier-transform infrared (ATR-FTIR) imaging of tissues and live cells. Chemical Society Reviews, 45(7), 1850-1864.
- Geminiani, L., Campione, F., Corti, C., Luraschi, M., Motella, S., Recchia, S., & Rampazzi, L. (2022). Differentiating between Natural and Modified Cellulosic Fibres Using ATR-FTIR Spectroscopy. Heritage, 5(4), 3127-3144.
- Kendix, E. L., Prati, S., Joseph, E., Sciutto, G., & Mazzeo, R. (2009). ATR and transmission analysis of pigments by means of far infrared spectroscopy. Analytical and Bioanalytical Chemistry, 394, 1023-1032.
- Kim, T., Cho, M., & Kwak, K. (2024). Quantitative Analysis of the Li-Ion Solvation Structure in Li-Ion Battery Electrolytes Using ATR-FTIR Spectroscopy. Analytical Chemistry.
- Laroche, G., Fitremann, J., & Gherardi, N. (2013). FTIR-ATR spectroscopy in thin film studies: The importance of sampling depth and deposition substrate. Applied Surface Science, 273, 632-637.
- Liu, G.-L., & Kazarian, S. (2022). Recent advances and applications to cultural heritage using ATR-FTIR spectroscopy and ATR-FTIR spectroscopic imaging. The Analyst, 147, 1775-1797.
- Nunn, S., & Nishikida, K. (2008). Advanced ATR Correction Algorithm. Thermo Fisher Scientific Technical Note.
- Saraiva, R. G., Lopes, J., Machado, J., Gameiro, P., & Feio, M. (2014). Discrimination of single-porin Escherichia (E.) coli mutants by ATR and transmission mode FTIR spectroscopy. Journal of Biophotonics, 7(11-12), 920-927.
- Tiernan, H., Byrne, B., & Kazarian, S. (2020). ATR-FTIR spectroscopy and spectroscopic imaging for the analysis of biopharmaceuticals. Spectrochimica Acta Part A: Molecular and Biomolecular Spectroscopy, 241, 118636.
- Volkov, D., Rogova, O., & Proskurnin, M. (2021). Organic Matter and Mineral Composition of Silicate Soils: FTIR Comparison Study by Photoacoustic, Diffuse Reflectance, and Attenuated Total Reflection Modalities. Agronomy, 11(9), 1879.
- Vongsvivut, J., Pérez-Guaita, D., Wood, B., Heraud, P., Khambatta, K., Hartnell, D., Hackett, M., & Tobin, M. (2019). Synchrotron macro ATR-FTIR microspectroscopy for high-resolution chemical mapping of single cells. The Analyst, 144(10), 3226-3238.
- Yan, C., Huang, W., Xiao, F., & Lv, Q. (2018). Influence of polymer and sulphur dosages on attenuated total reflection Fourier transform infrared upon Styrene–Butadiene–Styrene-modified asphalt. Road Materials and Pavement Design, 20(7), 1586-1600.