How to Interpret Oil Analysis Results Like a Pro
Oil analysis is one of the most effective strategies for anyone who wants to prevent premature equipment failure and the massive costs that come with it. You receive a report that’s essentially a blood test for your equipment, showing you exactly what’s happening deep inside.
But the real business advantage comes from a solid oil analysis interpretation. This is the skill that distinguishes a standard maintenance routine from a highly effective asset management program.
Why a Proper Oil Analysis Interpretation Matters
A solid grasp of these reports is what separates a proactive maintenance approach from a reactive one that's constantly putting out fires.
A successful oil analysis report interpretation allows you to identify the earliest signs of component fatigue and optimize oil change intervals, which helps prevent catastrophic failures while reducing operational costs and environmental impact. Advanced frameworks can identify critical degradation mechanisms and service hour thresholds, allowing for more precise and effective maintenance strategies (Camba et al., 2025).
Even in specialized applications like transformer monitoring, standardized interpretation models improve diagnostic accuracy and reduce the reliance on subjective expert judgment, especially when traditional methods fall short (Abu-Siada et al., 2013).
Related article: A Guide to Wear Metal Analysis for Oil
How to Interpret Oil Analysis Results: Our Step-by-Step Playbook

When that report arrives, it can appear to be an intimidating collection of data points. But within that data is a clear story about your equipment's condition. We’ve developed a process that consistently extracts the most valuable, actionable information.
Step 1: Review the Summary
First, take a look at the lab's overall assessment. This is your 30,000-foot view, often presented with color codes—green for normal, yellow for caution, red for critical. It’s a useful starting point to immediately gauge if you have a fire to put out.
However, our strongest advice is to never stop there. The summary is generated by automated limits and lacks the operational context that you have, which is critical for a nuanced oil analysis results interpretation.
Step 2: Verify the Sample Information
Next, ensure every detail on the report is correct: the equipment ID, the specific oil grade, and the hours or miles on that oil. It's a fundamental step, but it's frequently overlooked.
We've seen teams waste valuable time investigating a "viscosity shear" issue, only to find out the report had the wrong oil grade listed. Incorrect service hours can make a normal wear rate look alarming, leading to a flawed interpretation.
Step 3: Analyze the Elemental Content
This is where the picture of your machine's health really starts to form. You need to examine the elemental data, measured in parts per million (ppm).
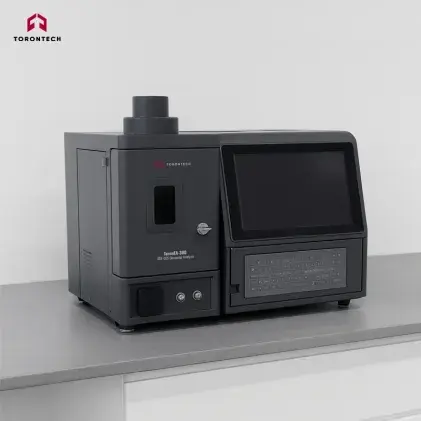
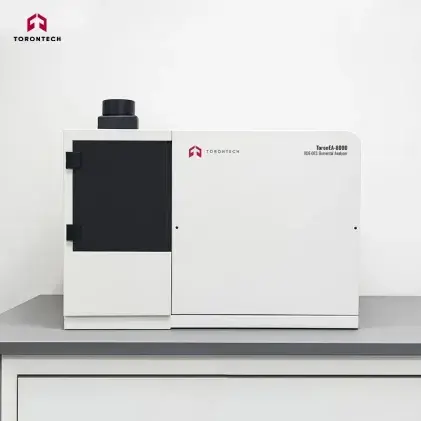
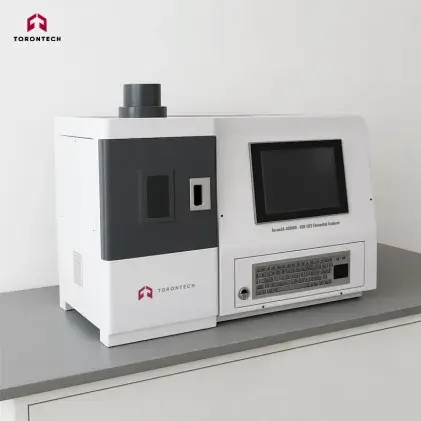
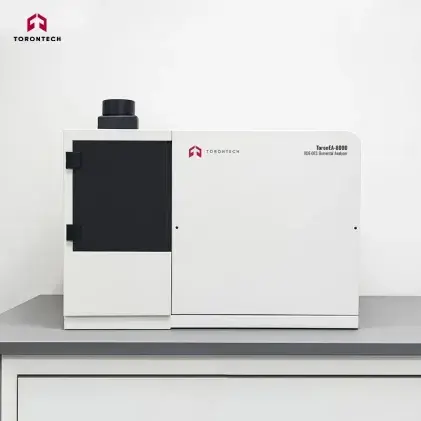
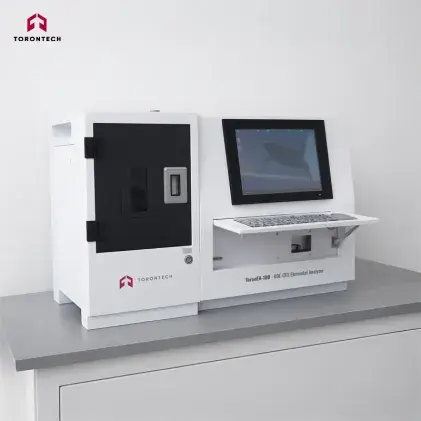
This detailed data is precisely what a spectrometer, like our ToronEA-8000H for high-volume labs, is built to deliver. A key part of knowing how to interpret oil analysis results is understanding these three groups:
- Wear Metals: These are your primary indicators of which specific internal components are breaking down. We're looking for iron (Fe) from gears and cylinders, copper (Cu) and lead (Pb) from bearings, chromium (Cr) from piston rings, and aluminum (Al) from pistons or housings.
- Contaminants: These are destructive foreign substances. Silicon (Si) combined with aluminum (Al) is the classic signature of dirt ingestion, which acts like liquid sandpaper inside your machine. Sodium (Na) and potassium (K) are tell-tale signs of a coolant leak.
- Additive Elements: These are the beneficial elements that make the oil work effectively. This includes zinc (Zn) and phosphorus (P) for anti-wear, and calcium (Ca) or magnesium (Mg) as detergents. When you see these numbers drop, the oil's protective qualities are diminishing.
For instance, imagine a report for a haul truck shows iron (Fe) levels jumping from a steady 20 ppm to over 150 ppm. A correct oil analysis interpretation would point this directly to severe bearing and shaft wear, allowing the team to replace the component before a catastrophic failure.
Step 4: Evaluate the Oil's Condition
Here, you check the overall health of the lubricant itself. If the oil isn’t in good shape, it can no longer provide adequate protection.
- Viscosity: This measurement of the oil's thickness is incredibly telling. If it’s too high, the oil may have oxidized. If it’s too low, it’s often a sign of fuel dilution, which reduces film strength and accelerates wear.
- Acid Number (AN) & Base Number (BN): The AN tracks corrosive byproducts. As it rises, your machine is at risk. The BN shows the oil’s reserve to neutralize those acids. A low BN means the oil has lost its ability to fight back.
Step 5: Compare with Previous Reports for Trend Analysis
We need to be clear about this: a single report offers limited value. The real, actionable story is revealed through trend analysis.
This means plotting the data from several reports to establish a normal baseline. This is the foundation of an effective oil analysis results interpretation.
Consider this example: a new report shows 25 ppm of silicon (Si). On its own, that might not trigger an alarm. But if the previous five reports were all under 5 ppm, that spike is a critical red flag for an air filtration breach.
This is why having a compact unit like the ToronEA-300 to run frequent checks is so valuable; it helps build a rich trend history quickly.
Step 6: Correlate with Other Condition Data
If you employ other technologies, integrate those findings. Does a new vibration signature correspond with a rise in wear metals?
When data from multiple sources points to the same conclusion, you can proceed with a high degree of confidence in your oil analysis interpretation.
Step 7: Take Action
The final step is to formulate a plan. An analysis that doesn’t lead to a decision is an expense.
The action should match the severity of the findings, based on your interpretation. It could be a simple re-sample or a targeted inspection. The key is to make a timely, informed decision.
Common Oversights in Oil Analysis Report Interpretation
To ensure your conclusions are accurate, try to avoid these common missteps:
- Using a Poor Sample: A contaminated sample will always lead to incorrect conclusions and wasted effort.
- Overreacting to a Single Report: A single high reading could be an anomaly. The most reliable insights come from the trend over time.
- Ignoring Operating Context: A machine's operating conditions are essential for an accurate oil analysis report interpretation.
- Failing to Act on the Data: The delay between sampling and receiving a report from an outside lab is often a barrier to taking swift action.
Other common oversights include a rigid reliance on fixed time intervals instead of condition-based criteria and failing to recognize multiple degradation mechanisms that may be occurring at once. Inconsistent interpretation due to subjective judgment can also lead to missed opportunities for early intervention and cost savings (Camba et al., 2025; Abu-Siada et al., 2013; Hur et al., 2010).
The Torontech Approach to Oil Analysis
At Torontech, our conviction is that getting this critical data should be a straightforward and cost-effective process.
That's why we developed our ToronEA-Series of RDE-OES Rotating Disc Electrode Optical Emission Spectrometers. They provide the lab-grade analysis you need without the typical operational hurdles.
Why wait on long turnaround times when you can get a complete elemental profile in approximately 30 seconds? Our systems are designed for efficiency, empowering you to make critical maintenance decisions more quickly. Whether you need an ultra-compact unit for a mobile lab like the ToronEA-300, or a high-capacity system for a busy commercial lab like the ToronEA-8000H, we have a cost-effective solution that delivers reliable performance.
When you're ready to improve the speed and efficiency of your oil analysis interpretation program, we invite you to contact us. We would be happy to discuss your specific needs and provide a free quote on our RDE-OES spectrometers.
References:
- Camba, R., Garcia, C., Tobar, M., & Merchan, J. (2025). An Integrated Methodological Approach for Interpreting Used Oil Analysis in Diesel Engines. Lubricants.
- Abu-Siada, A., Hmood, S., & Islam, S. (2013). A new fuzzy logic approach for consistent interpretation of dissolved gas-in-oil analysis. IEEE Transactions on Dielectrics and Electrical Insulation, 20, 2343-2349.
- Hur, M., Yeo, I., Park, E., Kim, Y., Yoo, J., Kim, E., No, M., Koh, J., & Kim, S. (2010). Combination of statistical methods and Fourier transform ion cyclotron resonance mass spectrometry for more comprehensive, molecular-level interpretations of petroleum samples. Analytical chemistry, 82 1, 211-8.