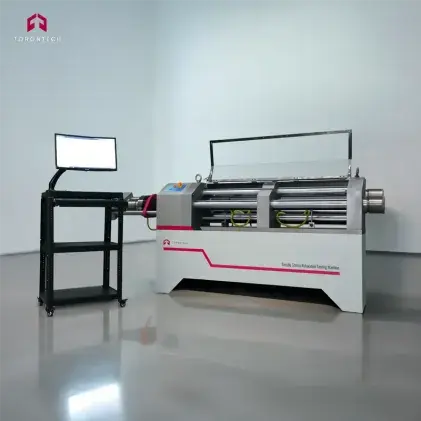
What is a Stress Relaxation Curve? A Complete Guide
The long-term reliability of components is a fundamental challenge in engineering. A critical part of this is a phenomenon called stress relaxation—the tendency for a material under a constant strain to lose its internal stress over time. Think of a high-tensile bolt in a critical assembly; you need absolute confidence that the tension applied during installation will remain there for the service life of the product.
The tool for gaining that confidence is the stress relaxation curve. It’s an essential piece of intelligence that shows you exactly how your materials will behave when they're put to the test for the long haul.
How to Interpret Data from a Stress Relaxation Curve
This stress relaxation curve provides a clear, visual story of a material's stress decay. To make sense of it, you first need to know what you're looking at on the two axes:
- The Y-Axis (the vertical one): This shows the amount of stress inside the material. The higher up the line, the more stress the material is holding.
- The X-Axis (the horizontal one): This represents the passage of time. As you move from left to right, you're seeing how the material behaves over hours, weeks, or even months.
Once you have that down, you can see the stress relaxation curve's story unfold in two key phases:
- A Sharp Initial Drop: When a test begins, the stress is at its peak. You will always observe a steep decline right at the start. This represents the rapid internal adjustments the material makes as it settles under the load.
- A Gradual Stabilization Phase: Following the initial phase, the rate of decay slows considerably, and the curve begins to flatten out. This is the portion of the graph we pay the closest attention to, as it reveals the material's ability to maintain a stable, residual stress for an extended period.
But the real value comes from extracting specific numbers from the stress relaxation curve. We see professionals focus on a few key metrics:
- Residual Stress: This is the amount of stress left in the material after a specific amount of time has passed, often expressed as a percentage of the initial stress.
- Relaxation Rate: The speed of the stress drop on the curve. A slower rate indicates a more stable material.
- Industry Benchmarks: Many industries use a standard time marker, such as 1,000 hours, to allow for direct comparison between materials.
This information allows us to move beyond a general impression and get to the specific data points needed to engineer components with genuine, quantifiable long-term dependability.
The Key Factors That Influence Your Stress Relaxation Curve
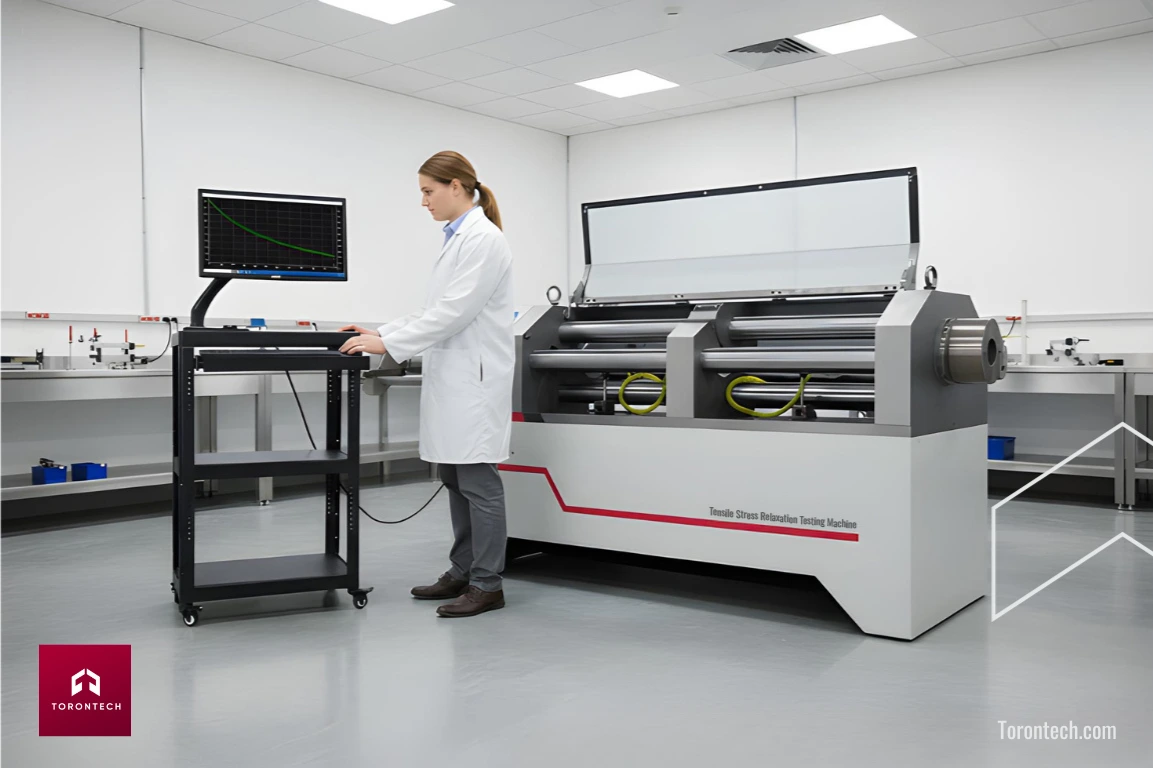
The shape of this stress relaxation curve isn't fixed; several powerful factors can influence it. It’s essential for these variables to be tightly controlled:
- Temperature: Increased heat accelerates stress relaxation. Testing at a constant, controlled temperature is critical, requiring an Isothermal Stress Relaxation Tester.
- Initial Stress Level: Higher initial loads cause a more pronounced relaxation rate.
- Material Makeup: The alloy composition, grain structure, and processing history determine a material’s inherent resistance to stress loss.
- Time: The longer a material is under strain, the more its internal stress decreases.
How Professionals Apply Stress Relaxation Curve Data
Accurate stress relaxation data is the foundation for sound engineering and business decisions. Here’s how it’s applied:
Material Selection and Ranking
When choosing between alloys, comparing their stress relaxation curves makes the decision objective. For example, an automotive engineer designing cylinder head bolts can compare steel versus alloy bolts to ensure consistent clamping force at high temperatures. The flatter curve shows the more reliable material.
Forecasting Component Lifespan
Tests may run for weeks, but components must perform for years. Using models to extrapolate the stress relaxation trend provides a reliable forecast of residual stress, as with pre-stressed steel tendons in bridges designed for decades of service.
Fueling Accurate Simulations
Simulation software depends on real-world data. Stress relaxation data provides the input for accurate modeling. For example, aerospace engineers use this data to simulate landing gear performance over thousands of cycles. Without it, simulations remain speculative.
Why Precision in Measurement is Non-Negotiable
The reliability of your product is tied directly to the accuracy of your testing data. An incorrect stress relaxation curve can lead to poor material choices or underperforming products. Dependable testing equipment ensures trustworthy data, and a high-fidelity Isothermal Stress Relaxation Tester provides this precision.
Related article: Stress Relaxation Testers: Advantages & How to Choose
Torontech: Your Partner for Reliable and Cost-Effective Testing
At Torontech, our focus is on your results. We deliver cost-effective equipment designed for accuracy and dependability. Our Isothermal Stress Relaxation Tester for Reinforcing and Prestressing Steel offers a stable, temperature-controlled testing environment and complies with ASTM E328 and ISO 15630-3 standards. With precision sensors and automated data logging, it delivers the consistency required for confident decisions.
If you’re looking to enhance your testing capabilities, our team is ready to assist. Contact us today to discuss your needs for cost-effective material testing solutions.
References
- Hariharan, K., & Jain, J. (2020). Stress relaxation test: Issues in modelling and interpretation. Manufacturing Letters, 26, 64-68. doi.org/10.1016/j.mfglet.2020.10.003
- Segura-Méndez, K., Puente-Córdova, J., Rentería-Baltiérrez, F., Luna-Martínez, J., & Mohamed-Noriega, N. (2025). Modeling of Stress Relaxation Behavior in HDPE and PP Using Fractional Derivatives. Polymers, 17. doi.org/10.3390/polym17040453
- Povolo, F. (1981). On the analysis of stress relaxation data. Journal of Nuclear Materials, 96, 178-186. doi.org/10.1016/0022-3115(81)90231-2
- Youliang, Y. et al. (2020). Stress-relaxation ageing behavior and microstructural evolution under varying initial stresses in an Al–Cu alloy: Experiments and modeling. International Journal of Plasticity, 127, 102646. doi.org/10.1016/j.ijplas.2019.102646
- Stankiewicz, A. (2023). A Class of Algorithms for Recovery of Continuous Relaxation Spectrum from Stress Relaxation Test Data Using Orthonormal Functions. Polymers, 15. doi.org/10.3390/polym15040958
- Stankiewicz, A. (2024). Robust Recovery of Optimally Smoothed Polymer Relaxation Spectrum from Stress Relaxation Test Measurements. Polymers, 16. doi.org/10.3390/polym16162300
- Zhao, J. et al. (2022). Modelling stress relaxation after hot deformation: microstructure-property relationships in Nb-bearing steels. International Journal of Plasticity. doi.org/10.1016/j.ijplas.2022.103219
- Prasad, K. et al. (2022). Rigorous analysis and pragmatic guidelines in estimating strain rate sensitivity using stress relaxation test. Mechanics of Materials. doi.org/10.1016/j.mechmat.2022.104279