Improving Material Stability with Thermogravimetric Testing
TGA thermogravimetric analysis helps you understand how materials behave under heat. It tracks changes in mass as temperature increases, helping you study decomposition, stability, or moisture content. This method is widely used in laboratories and industries that depend on material performance.
But what does the TGA curve really tell you? And how can this analysis improve product quality or research outcomes? This article gives you a clear and practical overview, written for anyone working with materials, from polymers to pharmaceuticals.
Key Takeaways
- Thermogravimetric Analysis measures how a material's mass changes as temperature increases over time.
- This method is critical for determining thermal stability, composition, and oxidative stability.
- Industries ranging from polymers to pharmaceuticals use TGA for quality control and failure analysis.
- Testing must adhere to international standards like ASTM E1131 and ISO 11358 for validity.
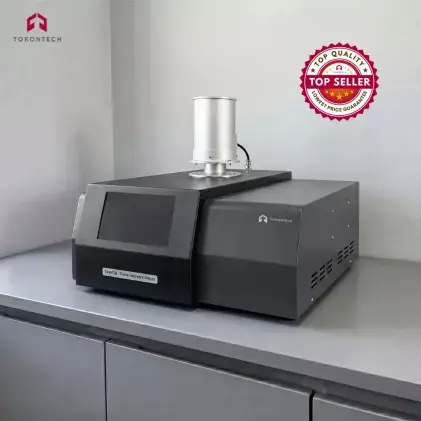
- Advanced instruments like the ToronTGA Series ensure high precision heating and accurate data capture.
What Is TGA Thermogravimetric Analysis?
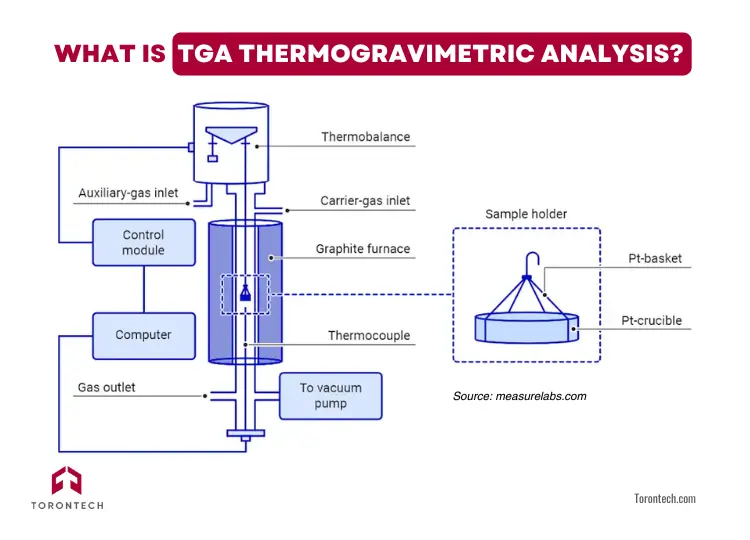
TGA stands for thermogravimetric analysis, a method used to measure mass loss during heating. It works by exposing a sample to controlled temperature changes while continuously tracking its weight. As temperature rises, volatile components, water, or gases leave the material, causing weight shifts.
You can use this method to detect moisture, fillers, decomposition stages, or oxidation behavior. It’s commonly used during R&D, quality control, or failure analysis in labs. A typical TGA setup includes:
- Precision balance and furnace system
- Gas purge unit (nitrogen, oxygen, or argon)
- Real-time software for data acquisition
How Does TGA Work?
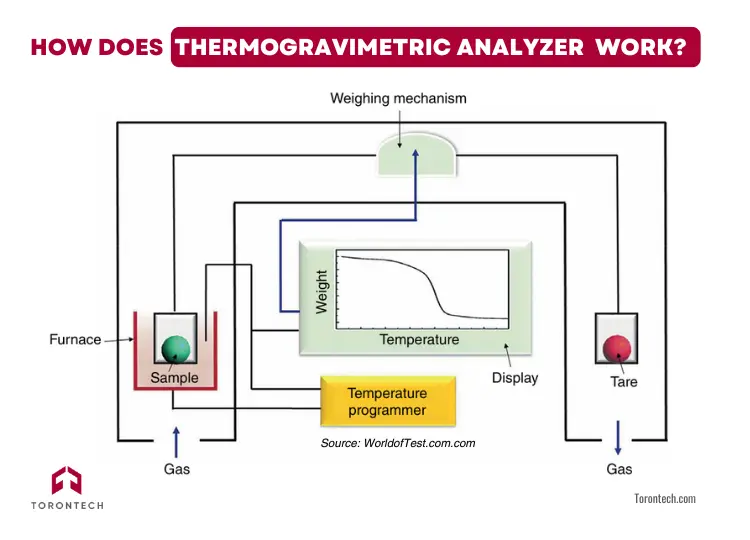
You begin by placing a small sample into a pan inside a precision furnace. This pan sits on a highly sensitive balance that records even the slightest change in weight. As the temperature follows a controlled program—usually heating—the sample undergoes physical or chemical changes.
Related article: TGA Sample Preparation: A Complete Guide
The system purges the chamber with inert or reactive gas to create a stable testing environment. As heating progresses, the sample might lose mass from moisture, solvents, or decomposition. It can also gain mass if oxidation or gas absorption occurs.
Your results appear as a TGA curve, which plots mass against temperature or time. To analyze events more precisely, a DTG curve (first derivative) is often used. This highlights where rapid changes occur, ideal for detecting reactions like evaporation, degradation, or oxidation.
This process helps you uncover insights about material composition, stability, purity, and thermal behavior, all in one experiment.
Looking for high-precision analysis? Reliable results start with the right hardware. Many industry leaders rely on the ToronTGA Series Thermogravimetric Analyzer to ensure their materials meet strict ASTM and ISO compliance requirements.
Three Types of Thermogravimetric Analysis
TGA tests can follow different temperature programs, depending on your testing goals. You can select the right approach based on how your material behaves or what you need to investigate.
1. Dynamic TGA
This is the most commonly used method. You heat the sample at a steady, linear rate—typically a few degrees per minute. It’s useful when you want to study overall thermal stability or observe decomposition stages across a full temperature range.
2. Isothermal TGA
In this method, the temperature stays constant while the sample weight is tracked over time. It's great for testing long-term thermal stability or slow reactions that occur at a specific temperature.
3. Quasistatic TGA
You apply heat in steps, holding the sample at each level until the weight stabilizes. Then the temperature increases again. This method helps when your sample has overlapping reactions.
Reading and Interpreting the TGA Curve
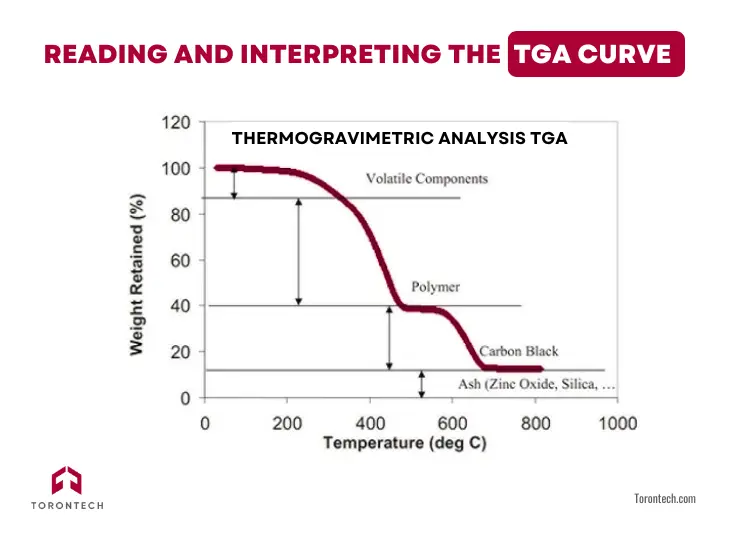
When you run a TGA thermogravimetric analysis, the curve is your guide. It tells you how your sample reacts as temperature changes. The x-axis shows temperature or time. The y-axis reflects how much mass your sample loses, usually as a percentage.
Each section of the curve represents a physical or chemical process. Here's how to interpret it:
- Flat regions mean stability—your sample doesn’t lose weight in this range.
- Sloped drops show mass loss, often caused by moisture evaporation or decomposition.
- Multiple steps suggest that different components decompose at different temperatures.
At the end, the remaining mass is called residue. This could be inorganic fillers, char, or ash left behind after thermal breakdown.
You can read more here: How to Interpret a TGA Curve: An Expert Guide
Sometimes, external factors like buoyancy or instrument drift can cause noise. Comparing with a blank curve helps correct these artifacts. A real-time TGA system with DTG curve support allows you to pinpoint thermal events with greater precision.
Real-World Applications of TGA
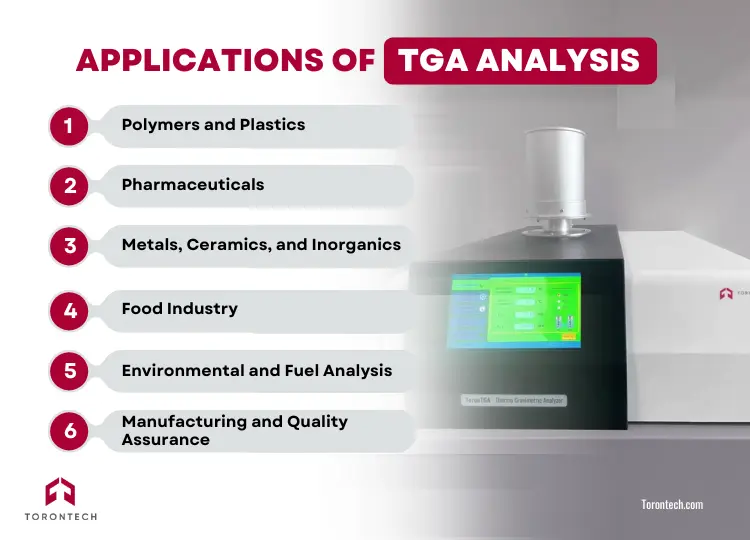
TGA is a staple in material research, but broad definitions rarely solve niche problems. Here is how specific sectors utilize this technology to overcome operational hurdles:
1. Polymers and Plastics
In automotive and aerospace manufacturing, TGA is essential for checking filler levels in composites. Take glass-fiber-reinforced nylon, for instance. TGA burns away the polymer matrix to accurately gauge the percentage of glass fiber left behind. This guarantees the finished component meets structural requirements without becoming fragile.
2. Pharmaceuticals
Differentiating between surface moisture and bound crystal water in drug formulas is critical. If a tablet holds too much loose moisture, it might spoil quickly on the shelf. TGA pinpoints the specific temperature where water evaporates, enabling producers to forecast shelf stability with confidence and avoid spoilage in damp environments.
3. Metals, Ceramics, and Inorganics
For advanced ceramic production, TGA is key to fine-tuning the binder burnout phase. Before sintering a part, the organic binders used for shaping need to be removed. TGA establishes the exact heating pace needed to eliminate these binders without cracking or warping the "green body," which cuts down on production waste.
4. Food Industry
In food processing, TGA evaluates thermal stability and moisture levels, which directly affect texture and safety. For example, with edible oils, TGA tracks oxidation stability—how quickly the oil goes rancid under heat. It also helps with powdered milk by spotting moisture levels that might trigger bacterial growth or clumping.
5. Environmental and Fuel Analysis
TGA offers a quick proximate analysis for coal, biomass, and soils. In just one run, it can measure moisture, volatile matter, fixed carbon, and ash content in sequence. This information is necessary for energy firms to figure out the calorific value of their fuel and estimate carbon emissions for regulatory compliance.
6. Manufacturing and Quality Assurance
For QA managers, TGA serves as a fingerprinting method for incoming materials. By matching the thermal decomposition curve of a new shipment against a "Gold Standard" reference, manufacturers can immediately spot impurities or unapproved formula tweaks from suppliers—making sure a defective batch never reaches the assembly line.
Related article: How to Choose a TGA: A Practical Guide
Calibration and Standards for TGA
If you rely on TGA for accurate results, proper calibration is mandatory. To ensure your data remains valid, you must regularly verify three core areas: Temperature, Weight, and Baseline stability.
Adhering to protocols like ASTM E1582 and ASTM E2040 ensures your heating rates and balance readings align with international standards. Since correct calibration involves specific procedures, we have compiled a dedicated resource to help you get it right.
Read our step-by-step guide on TGA Calibration here.
Key International Standards for TGA:
- ASTM E1131 – For compositional and thermal analysis by TGA
- ASTM E1582 – Temperature calibration using melting point or magnetic standards
- ASTM E2040 – Mass scale calibration for accurate weight readings
- ISO 11358 – Global standard for conducting thermogravimetric analysis of polymers and other materials
These standards guide everything from setup to data interpretation. Following them helps you produce consistent results that meet industry or regulatory expectations. If you're working under ASTM or ISO methods, using a TGA system designed for accuracy and compliance helps ensure your results meet global standards.
How TGA Compares to Other Thermal Analysis Methods
Thermogravimetric Analysis is seldom performed alone. To get a full overview of a material, it is frequently paired with other thermal analysis techniques.
TGA vs. DSC (Differential Scanning Calorimetry)
While both methods involve heating a sample, they track different properties. TGA records the change in mass, whereas DSC tracks the change in heat flow (energy). TGA is the better choice for decomposition and solvent loss, while DSC detects melting points, glass transitions, and crystallization.
Read our detailed guide on the differences between TGA and DSC here.
TGA vs. LOD (Loss on Drying)
Loss on Drying is a static, typically manual process used mainly to find moisture content by drying a sample in an oven. TGA is a dynamic, automated method that gives you a continuous profile of mass loss as temperatures increase. TGA offers much higher precision and can distinguish between different types of volatiles, whereas LOD simply provides a total weight loss figure.
Learn more about when to switch from LOD to TGA in our in-depth article.
Cost-Effective TGA Solutions by Torontech
TGA thermogravimetric analysis gives you more than just numbers. It helps you see how materials behave, how stable they are, and what changes during heat exposure.
Whether you're running QA tests or developing new products, TGA gives clear, usable insights. Looking to add this capability to your lab?
Explore the ToronTGA Analyzer to bring reliable thermal analysis into your workflow.
References:
Mansa, R., & Zou, S. (2021). Thermogravimetric analysis of microplastics: A mini review. Environmental Advances. doi.org/10.1016/j.envadv.2021.100117
Gerassimidou, S., Velis, C., Williams, P., & Komilis, D. (2020). Characterisation and composition identification of waste-derived fuels obtained from municipal solid waste using thermogravimetry: A review. Waste Management & Research, 38, 942 - 965. doi.org/10.1177/0734242x20941085
Saadatkhah, N., Garcia, A., Ackermann, S., Leclerc, P., Latifi, M., Samih, S., Patience, G., & Chaouki, J. (2019). Experimental methods in chemical engineering: Thermogravimetric analysis—TGA. The Canadian Journal of Chemical Engineering. doi.org/10.1002/cjce.23673
Erdey, L., Paulik, F., & Paulik, J. (2020). Differential Thermogravimetry. Nature, 174, 885-886. doi.org/10.1038/174885b0
García, R., Pizarro, C., Lavín, A., & Bueno, J. (2013). Biomass proximate analysis using thermogravimetry. Bioresource technology, 139, 1-4. doi.org/10.1016/j.biortech.2013.03.197
Liu, J., Xuan, Y., Teng, L., Zhu, Q., Zheng, H., & Liu, X. (2023). Design and application of a novel direct light-driven thermogravimetric analyzer. Solar Energy. doi.org/10.1016/j.solener.2023.02.006
Bondarchuk, I., Bondarchuk, S., Vorozhtsov, A., & Zhukov, A. (2023). Advanced Fitting Method for the Kinetic Analysis of Thermogravimetric Data. Molecules, 28. doi.org/10.3390/molecules28010424
Yang, Y., Jia, H., Li, Z., Cao, Z., Zhang, H., Xu, P., & Li, X. (2025). Thermocouple-integrated resonant microcantilever for on-chip thermogravimetric (TG) and differential thermal analysis (DTA) dual characterization applications. Microsystems & Nanoengineering, 11. doi.org/10.1038/s41378-024-00828-9