MVR vs MFR Guide: Differences, Formulas & Equipment
What if your quality team could guarantee raw resin consistency before material ever reaches the production line?
Precise melt flow characterization is the fastest way to keep extrusion and injection molding running at peak efficiency. Comparing MFR vs MVR (and MVR vs MFR) gives your facility a reliable method to verify incoming batches, prevent processing defects, and protect profit margins without adding unnecessary testing overhead.
Here is your direct comparison, conversion formula breakdown, and equipment selection guide.
MFR vs MVR: Core Differences
For decision-makers needing a quick summary, interlaboratory studies show that MVR delivers superior repeatability and reproducibility compared to MFR on benchmark polymers such as polypropylene, achieving repeatability of ~5% versus ~7% and reproducibility of ~11% versus ~21% at a 95% confidence level.
| Evaluation Factor | Melt Flow Rate (MFR) | Melt Volume Rate (MVR) |
|---|---|---|
| Primary Property | Mass flow rate (molar mass indicator) | Volumetric flow rate (shear flow indicator) |
| Datasheet Units | g/10 min | cm³/10 min |
| Official Test Standard | ASTM D1238 Method A / ISO 1133-1 Method A | ASTM D1238 Method B / ISO 1133-1 Method B |
| Laboratory Routine | Timed manual snip-and-weigh | Digital optical displacement tracking |
| Operator Involvement | Substantial (manual timing, cutting, weighing) | Minimal (automated tracking, digital export) |
| Repeatability (PP Benchmark) | ~7% | ~5% |
| Reproducibility (PP Benchmark) | ~21% | ~11% |
| Filler Sensitivity | Heavily altered by dense mineral fillers | Immune to filler density bias; reflects true volumetric flow |
| Test Duration | 15–20 minutes of hands-on attention | 5–8 minutes with automated calculations |
| Primary Application | Basic verification of unfilled virgin resins | High-volume QA, filled compounds, R&D labs |
What is Melt Flow Rate (MFR)?
Melt Flow Rate (MFR), often referenced as Melt Flow Index (MFI) or Melt Mass-Flow Rate, quantifies the actual mass of molten polymer pushed through a standardized tungsten carbide die (2.095 ± 0.005 mm internal diameter) under a fixed load and temperature over 10 minutes. Governed by ASTM D1238 (Procedure A) and ISO 1133-1 (Method A), this gravimetric approach expresses flowability in grams per 10 minutes (g/10 min).
During a standard Procedure A run, polymer granules or flakes are loaded into a heated cylindrical barrel. Following a set preheat dwell time, a calibrated piston weight applies continuous downward pressure. As a strand extrudes through the die, an automated timer blade or manual cutter shears segments at precise time intervals.
Instruments like the entry-level ToronMFI™-A manage this step with a microprocessor-controlled automated scraper accurate to ±0.1 seconds, eliminating the timing inconsistencies of manual razor cuts. These cut segments cool, get weighed on an analytical balance with 0.1 mg resolution, and convert to a standard 10-minute rate:
MFR = (m × 600) / t
(Where m is the average mass of the cut segments in grams, and t is the cut interval in seconds.)
MFR serves as a practical inverse indicator of viscosity, providing a simpler alternative to rotational rheometry for assessing material processability. As molecular weight and molar mass increase, polymer chains resist displacement, resulting in lower MFR values.
In our view, Method A can be misleading because dense mineral additives artificially inflate strand weight, masking how much the material's viscosity has actually increased. While solid particles physically restrict flow and lower overall throughput, Method B (MVR) measures volumetric displacement directly, removing the mass bias and isolating the genuine flow behavior of the filled compound.
What is Melt Volume Rate (MVR)?
Melt Volume Rate (MVR), also referred to as Melt Volume-Flow Rate, quantifies the volume of molten polymer extruded through the standard capillary die under defined thermal and load conditions over 10 minutes. Regulated under ASTM D1238 (Procedure B) and ISO 1133-1 (Method B), this volumetric method records output in cubic centimeters per 10 minutes (cm³/10 min).
Rather than collecting, cooling, and weighing extruded strands, MVR utilizes high-resolution digital position sensors. Mid-range and advanced systems, such as the ToronMFI™-B and ToronMFI™-D, incorporate digital displacement tracking with ±0.02 mm resolution to record the linear descent of the weighted piston (l) over a precisely timed measurement interval (t).
Because standardized testing protocols fix A at 0.711 cm² (representing the nominal mean cross-sectional area of the 9.550 mm cylinder bore and the 9.474 mm piston head per ISO 1133 and ASTM D1238), the instrument software computes volumetric flow automatically from encoder displacement data:
MVR = (A × l × 600) / t
One major advantage of MVR is convenience: it does not require prior knowledge of the material's density for volume calculations. We consider MVR to be the more efficient and repeatable approach for quality assurance benches. It bypasses physical strand collection, eliminates balance-related delays, and produces clean numerical data with minimal operator intervention.
Calculating the Difference: MVR to MFR Conversion
When reviewing resin certificates from multiple suppliers, quality control teams often need to know how to calculate the difference from MVR and MFR or look to convert MVR to MFR. The mathematical link between the two values is the material's melt density (ρ_melt) at the specified test temperature:
MFR = MVR × ρ_melt
Conversely, to convert mass flow into volumetric flow:
MVR = MFR / ρ_melt
By simultaneously tracking mass and volumetric output under identical conditions, shear viscosity and melt density can be calculated directly. Advanced multi-parameter units like the ToronMFI™-V leverage built-in tablet software to compute melt density, apparent viscosity, shear stress, and shear rate in a single run, removing the need for manual calculation steps.
Critical Rule: Melt Density (ρ_melt) ≠ Solid Density (ρ_solid)
We frequently see testing teams make the mistake of using room-temperature solid density in these calculations. Thermoplastics undergo significant volumetric swell when heated past their melting points, meaning melt density is consistently lower than solid density. Consequently, melt density is typically 10% to 25% lower than ambient solid density.
For example, High-Density Polyethylene (HDPE) with an ambient density of 0.955 g/cm³ drops to a melt density of roughly 0.760 g/cm³ at its standard 190°C test temperature. Using the cold density value results in a calculation error exceeding 25%. Applying correct melt density values prevents modeling inaccuracies and reduces costs in downstream polymer flow simulations.
Step-by-Step Conversion Example
Suppose an incoming quality check on a Polypropylene (PP) homopolymer at 230°C / 2.16 kg yields a measured MVR of 14.20 cm³/10 min and a known melt density of 0.738 g/cm³ at 230°C.
First, apply the conversion formula: MFR = MVR × ρ_melt. Next, compute the mass rate by multiplying 14.20 cm³/10 min by 0.738 g/cm³, which equals 10.48 g/10 min. The resulting equivalent Melt Flow Rate is 10.48 g/10 min.
Melt Density Reference Guide
MVR increases with temperature due to greater free volume in the melt and decreases with high filler content as solid particles adsorb macromolecular chains and restrict flow. The temperature dependence of flow rate often follows an Arrhenius-type relationship.
Below is a reference guide of empirical melt densities (ρ_melt) for standard industrial thermoplastics tested under ASTM and ISO conditions:
| Polymer Material | Standard Test Temp (°C) | Standard Test Load (kg) | Nominal Solid Density (g/cm³) | Empirical Melt Density ρ_melt (g/cm³) |
|---|---|---|---|---|
| LDPE (Low-Density Polyethylene) | 190 | 2.16 | 0.918 – 0.925 | 0.762 |
| LLDPE (Linear Low-Density PE) | 190 | 2.16 | 0.918 – 0.935 | 0.765 |
| HDPE (High-Density Polyethylene) | 190 | 2.16 / 5.0 | 0.945 – 0.965 | 0.760 – 0.768 |
| PP (Polypropylene Homopolymer) | 230 | 2.16 | 0.900 – 0.910 | 0.738 |
| PS (General Purpose Polystyrene) | 200 | 5.00 | 1.040 – 1.060 | 0.945 |
| ABS (Acrylonitrile Butadiene Styrene) | 220 / 230 | 10.0 / 3.8 | 1.030 – 1.070 | 0.955 – 0.965 |
| PC (Polycarbonate) | 300 | 1.20 | 1.200 | 1.070 |
| PET (Polyethylene Terephthalate) | 275 / 285 | 2.16 | 1.350 – 1.400 | 1.200 |
| PA6 / PA66 (Polyamide / Nylon) | 235 / 275 | 2.16 | 1.130 – 1.150 | 0.980 – 1.010 |
| POM (Polyoxymethylene / Acetal) | 190 | 2.16 | 1.410 – 1.420 | 1.150 |
(Note for compounders: Heavy mineral additives, glass fibers, and silica nanoparticles alter both melt flow and melt density significantly. For reinforced formulations, we recommend measuring melt density directly using an indexer equipped for automated displacement tracking.)
Standards Compliance: ASTM D1238 vs ISO 1133
ASTM D1238 and ISO 1133 share equivalent core principles, utilizing an extrusion plastometer to force molten polymer through a capillary die under specified conditions. Historically, North American laboratories have calibrated against National Institute of Standards and Technology (NIST) reference materials such as SRM 1474 (measured at 5.03 g/10 min via ASTM D1238), while international reference materials demonstrate consistent alignment under ISO 1133-1.
For Tier-1 automotive molders in the Midwest industrial corridor (such as Michigan, Ohio, and Indiana) and Southern Ontario, dual compliance is a daily operational reality: incoming resins often arrive certified to ASTM D1238, while global OEM component specifications require validation under ISO 1133.
Thermal and Geometric Tolerances
Both standards specify identical die dimensions (8.000 ± 0.025 mm length and 2.095 ± 0.005 mm bore), but their operational tolerances diverge slightly. ASTM D1238 enforces a strict temperature window of ±0.2°C within 10 mm above the die, whereas ISO 1133-1 allows ±0.5°C. Preheating duration also differs, with ASTM specifying 7.0 ± 0.5 minutes compared to the 5.0 ± 0.5 minute clock mandated by ISO.
Testing instruments across the ToronMFI™-Series operate from 50°C to 450°C with thermal recovery under 4 minutes. For facilities requiring strict ASTM D1238 and ISO 1133-2 compliance, the advanced ToronMFI™-D maintains temperature control accuracy within ≤0.2°C, while the entry-level ToronMFI™-A and ToronMFI™-B provide reliable ±0.5°C control accuracy for standard ISO 1133-1 quality checks.
Specialty Resins and Advanced Testing Provisions
For materials with high flowability exceeding 50 g/10 min, ASTM Procedure C specifies half-height and half-diameter dies, while ISO accommodates high-flow resins through dedicated annexes. Multi-weight testing routines (ASTM Procedure D and ISO 1133 multi-load) evaluate Flow Rate Ratio (FRR) to assess molecular weight distribution.
Furthermore, ISO 1133-2 enforces strict dwell-time limits for polycondensates like PET and polyamides, reducing reproducibility scatter from 114% to approximately 60%. We consider dual-standard compliance essential for facilities managing raw material shipments from international vendors or exporting finished goods globally.
Method Selection Framework
Different manufacturing processes demand specific melt flow windows. For example, polypropylene packaging for thermoforming requires ~4 g/10 min, film extrusion uses up to 11 g/10 min, and injection molding spans 3 to 100 g/10 min depending on part wall thickness.
Evaluating Filled Compounds and PCR Blends
With increasing post-consumer recycled (PCR) mandates across North America (such as California AB 793, Washington State recycled content laws, and Canadian federal packaging regulations), processors frequently blend recycled HDPE and PP into virgin streams. Because PCR lots introduce batch-to-batch density shifts and thermal history variations, MVR testing provides a direct method for identifying degradation in recycled blends.
Colorants and heavy mineral fillers require the same volumetric approach. Heavy pigments like titanium dioxide (TiO2 at ~4.2 g/cm³) and carbon black (~1.8 to 2.1 g/cm³) are substantially denser than neat polyolefins (~0.9 g/cm³). As a result, a pigmented batch will produce a heavier extrudate and register an artificially higher MFR than its natural uncolored counterpart, even when the base polymer chains are identical.
Measuring MVR across natural and colored grades isolates pigment loading from true polymer viscosity. While solid fillers and pigments still restrict fluid motion physically, Method B (MVR) ensures that measured flow reductions reflect genuine melt rheology rather than a mass-based density artifact.
Testing Frequency and Throughput Demands
For facilities running more than 8 to 10 tests per shift, Method B (MVR) provides an immediate productivity advantage. Automating displacement tracking saves 10 to 12 minutes per sample by removing manual cutting, cooling, and analytical weighing steps.
Conversely, facilities conducting only periodic incoming verification on clean, unfilled polyolefins can comfortably rely on Method A (MFR) for basic quality checks.
Moisture-Sensitive Polycondensates
When processing moisture-sensitive resins like PET, PBT, or polyamides, Method B under ISO 1133-2 is strongly recommended. The automated sensor tracking captures piston displacement within tight preheat windows before ambient moisture causes hydrolytic chain scission, preventing thermal degradation from skewing test results.
Testing Troubleshooting and Error Diagnosis
A fundamental characteristic of standard melt flow testing is that test shear rates are substantially lower than actual extrusion or injection molding shear rates. Furthermore, materials with thermal instability, such as PVC, present unique testing challenges. When flow rate results deviate from supplier specifications, the root cause is often related to procedure or maintenance rather than out-of-spec resin.
Operational Variables: Air Entrapment and Cut Timing
Erratic or drifting MVR readings typically trace back to air voids trapped in the molten barrel during packing. Charging material in smaller increments and tamping firmly between additions evacuates air pockets effectively. High-resolution displacement encoders, such as the ±0.02 mm optical sensors on the ToronMFI™-D, quickly reveal these acceleration spikes if compaction is uneven.
For manual Method A tests, high scatter between cuts indicates operator timing variability, which is resolved by switching to an automated mechanical scraper accurate to ±0.1 seconds.
Material and Tooling Factors: Moisture Hydrolysis and Die Maintenance
A sudden, severe drop in melt viscosity during testing points to moisture-induced polymer hydrolysis, particularly in PET and polyamides. Resins must be dried thoroughly prior to testing, with nitrogen purging applied during preheating. Conversely, measured flow rates that sit noticeably below certified values often result from carbonized resin build-up inside the capillary die.
Maintaining barrel temperatures within the standard ASTM D1238 window of ±0.2°C prevents viscosity stratification along the melt column, and cleaning the tungsten carbide die with regular go/no-go gauge checks ensures the bore remains strictly within the 2.095 mm specification.
Laboratory ROI: Manual vs Automated Testing
We believe quality testing instruments should deliver tangible operational paybacks by reducing labor overhead and test cycle times. While modern machine learning and soft-sensor techniques are emerging to predict melt flow behavior in industrial IoT setups, upgrading physical laboratory hardware from manual cut-and-weigh testing (Method A) to automated optical displacement tracking (Method B) provides immediate efficiency gains.
Active Technician Time per Test
Manual Method A (MFR):
- Material Charging & Compaction: 2 minutes
- Preheating Cycle: 7 minutes
- Timed Cut Management (3–5 cuts): 3 minutes
- Cooling & Analytical Weighing: 4 minutes
- Manual Calculation & Logging: 2 minutes
- Total Time per Sample: ~18 Minutes
Automated Method B (MVR):
- Material Charging & Compaction: 2 minutes
- Preheating Cycle: 5–7 minutes
- Automated Displacement Tracking: 1 minute (continuous sensor recording)
- Automated Calculation & Direct Data Export: Instantaneous (via USB/RS485 PC links or integrated micro-printers)
- Total Time per Sample: ~8–10 Minutes (over 50% time savings)
Annual Financial Savings for an Industrial QA Laboratory
Assuming a facility runs 15 tests per day over 250 operating days per year (3,750 tests annually), labor costs can be modeled at 35.00 USD per hour, reflecting typical fully burdened wages for materials testing technicians according to U.S. Bureau of Labor Statistics (BLS) and Statistics Canada wage benchmarks.
Method A requires 1,125 technician hours annually (39,375 USD in labor), while automated Method B requires only 500 hours (17,500 USD in labor). This represents a direct labor savings of 21,875 USD per year. Combined with fewer re-tests and better scrap prevention, automated testing setups pay for themselves within a short operating window.
Melt Flow Indexer Selection
Choosing the right extrusion plastometer involves matching your daily sample throughput, required level of automation, and capital budget.
At Torontech, we supply testing instruments engineered to combine long-term reliability with accessible ownership costs, fully meeting the requirements of ASTM D1238 and ISO 1133. Units ship configured for 220V, with a 110V option available on request for North American laboratories. The ToronMFI™-Series Melt Flow Indexers provide targeted configurations for different laboratory demands:
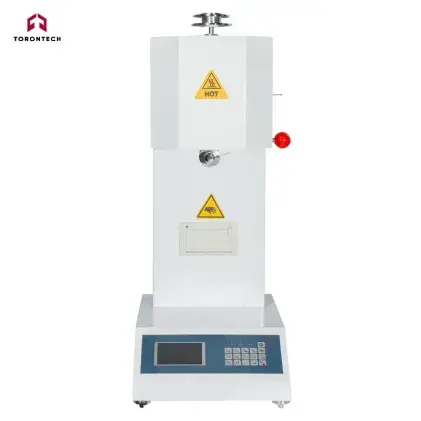
- ToronMFI™-A: A dependable, cost-effective base model dedicated to manual MFR (Method A) testing. Features microprocessor temperature control and an automated scraper accurate to ±0.1 s for routine incoming resin checks and lighter testing schedules.
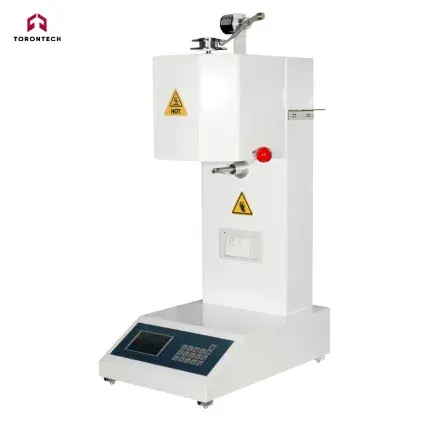
- ToronMFI™-B: A versatile, dual-capability tabletop system supporting both MFR and MVR (Methods A & B). Equipped with an integrated control panel, a built-in micro-printer, and ±0.02 mm displacement tracking across a 0.1 to 100 g/10 min measurement range.
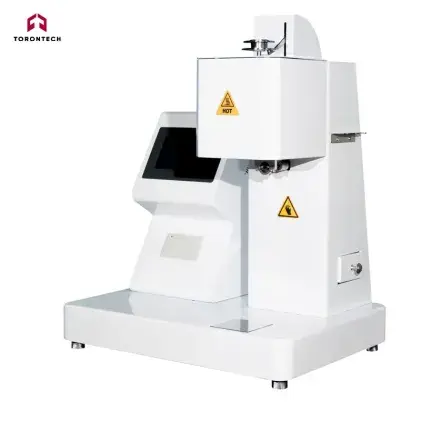
- ToronMFI™-D: A flagship automated model featuring a 7-inch color touchscreen, PC software connectivity via RS485/USB, an automatic scraper adjustable to ±0.1 s, and ±0.02 mm optical displacement accuracy for demanding 24/7 industrial quality control.
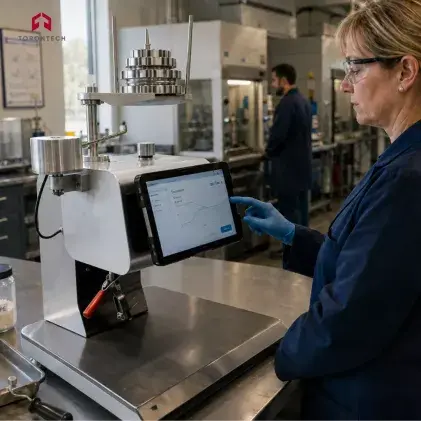
- ToronMFI™-V: A compact, multi-parameter indexer operated via a dedicated tablet computer. Simultaneously measures MFR, MVR, melt density, apparent viscosity, shear stress, and shear rate in a single test across a 50°C to 450°C operating span.
Upgrade Your Melt Flow Testing with Torontech
Evaluating MVR vs MFR allows processors to verify molecular consistency, optimize cycle times, and prevent out-of-spec production runs.
Headquartered in North America and serving industrial laboratories globally, Torontech delivers cost-effective solutions and innovative technologies across material testing. We provide high-precision instruments that ensure full compliance with ASTM and ISO standards while keeping your capital investment practical.
Ready to enhance your polymer testing operations? Explore our ToronMFI™ Series Melt Flow Indexers or contact our technical team to discuss your technical specifications and receive a customized quote for your facility.
References (Click to expand)
- Biçen, A. O., & Çağlı, Ç. (2025). Computerized Automation and Machine Learning for Prediction of Melt Mass-Flow Rate Using Custom-Built Machine in Industrial IoT. IEEE Transactions on Industrial Informatics, 21, 9468-9479.
- Dobránsky, J., & Doboš, Z. (2019). Effect of thermal degradation on rheological properties of polymeric materials. MATEC Web of Conferences, 299, 06001.
- Hadi, N., & Mohamed, D. J. (2016). Study the Relation between Flow, Thermal and Mechanical Properties of Waste Polypropylene Filled Silica Nanoparticles. Key Engineering Materials, 724, 28-38.
- Knapčíková, L., Dupláková, D., Radchenko, S., & Hatala, M. (2017). Rheological Behavior Modelling of Composite Materials used in Engineering Industry. TEM Journal, 6(2), 207-212.
- Lee, C. H., Lee, C. H., Sapuan, S., Lee, J., & Hassan, M. R. (2016). Melt volume flow rate and melt flow rate of kenaf fibre reinforced Floreon/magnesium hydroxide biocomposites. SpringerPlus, 5, 3044-1.
- Liang, J. (2010). Melt Rheology during Extrusion of Polypropylene Composites Filled with Diatomite Particles. Journal of Thermoplastic Composite Materials, 23, 265-276.
- Mertz, A. M., Mix, A., Baek, H., & Giacomin, A. J. (2013). Understanding Melt Index and ASTM D1238. Journal of Testing and Evaluation, 41, 50-62.
- Rides, M., Allen, C., Omloo, H., Nakayama, K., & Cancelli, G. (2009). Interlaboratory comparison of melt flow rate testing of moisture sensitive plastics. Polymer Testing, 28, 572-591.
- Shenoy, A. (2000). Material’s Volumetric-Flow Rate (MVR) as a Unification Parameter in Asphalt Rheology and Quality Control / Quality Assurance Tool for High Temperature Performance Grading. Applied Rheology, 10, 288-306.
- Traxler, I., Marschik, C., Farthofer, M., Laske, S., & Fischer, J. (2022). Application of Mixing Rules for Adjusting the Flowability of Virgin and Post-Consumer Polypropylene as an Approach for Design from Recycling. Polymers, 14(13), 2699.