MFI vs Viscosity: Test Differences & Selection Guide
An unexpected shift in resin flow can halt an injection or extrusion line within minutes, piling up scrap and draining your daily operating budget. While quality teams routinely track Melt Flow Index and Viscosity to catch these variations, each metric evaluates fluid resistance under fundamentally different flow conditions.
Treating MFI vs viscosity as interchangeable data leads directly to flawed blend ratios, tooling flash, and rejected shipments. This guide breaks down their inverse relationship, the mechanics behind the "Identical MFI Trap," and how to select the right testing equipment for your facility.
Technical Comparison: MFI vs Viscosity
For process engineers and lab managers needing an immediate side-by-side snapshot, the table below outlines the core operational and rheological distinctions between standard testing methods:
| Technical Parameter | Melt Flow Index (MFI / MFR) | Rotational Viscometer | Cone-and-Plate Viscometer |
|---|---|---|---|
| Core Definition | Mass or volume extruded through a standard die under a static load over 10 minutes. | Ratio of shear stress to shear rate via rotational drag within a moving fluid. | Shear resistance measured within a narrow gap between a shallow cone and flat plate. |
| Standard Units | g/10 min or cm3/10 min | cP, mPa·s, or Pa·s | cP, mPa·s, or Pa·s |
| Data Scope | Single-point, empirical quality-control indicator. | Multi-point, comprehensive physical property curve. | Multi-point, high-shear rheological profile. |
| Shear Rate Control | Low and variable (typically 1 to 50 s⁻¹; up to 1000 s⁻¹ with multi-weights). | Controlled across standard rotational ranges (0.01 to 1,000+ s⁻¹). | Controlled at high shear rates for small sample volumes. |
| Sample Requirement | Grams of solid polymer pellets or regrind. | Milliliters of liquid, paste, or melted resin. | Small sample volumes: 24 to 1,700 µL depending on spindle. |
| Industry Benchmarks | ASTM D1238, ISO 1133 | ASTM D2196, ISO 2555, ASTM D445 | ASTM D4287, ISO 2884, BS 3900 |
| Accuracy vs Reference | 5% to 40% error vs capillary rheometry. | Within 1% to 2% of full-scale calibration standards. | High repeatability under uniform shear gradients. |
| Hardware Example | Extrusion Plastometer (such as our ToronMFI™ Series) | Digital Viscometer (such as our ToronVisc™ E / S / 79 Series) | Cone-and-Plate System (such as our ToronVisc™ CAP2 / CAP3) |
What Is Melt Flow Index (MFI)?
Melt Flow Index (MFI), frequently documented as Melt Flow Rate (MFR) or Melt Volume Rate (MVR) on raw material certificates, is an empirical benchmark tracking the quantity of molten polymer pushed through a standardized orifice under a set dead-weight load and temperature during a ten-minute window.
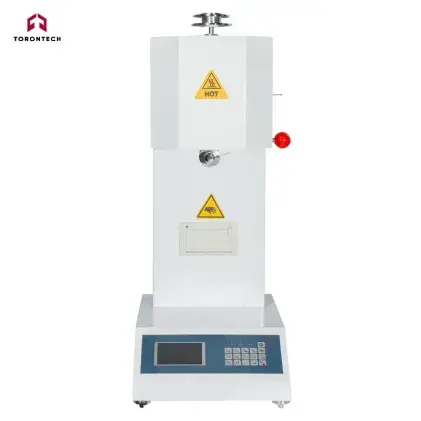
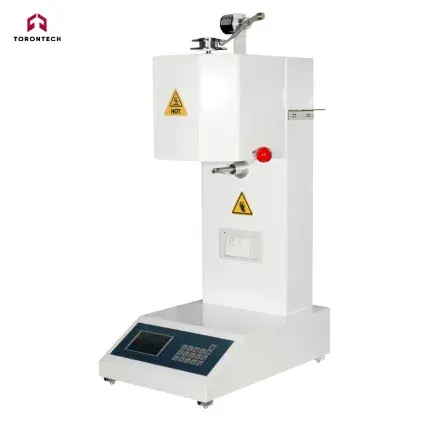
Governed globally by ASTM D1238 and ISO 1133, the test reports either mass displacement (MFR in g/10 min) or volumetric displacement (MVR in cm3/10 min). Facilities execute these evaluations using benchtop extrusion plastometers, such as our tabletop ToronMFI™ Series.
How the Measurement Operates
Technicians fill a vertical heated cylinder with thermoplastic pellets, regrind, or compounded granules. After compacting the sample to remove trapped air pockets, the material preheats to a set target (such as 190°C for standard polyethylene or 230°C for polypropylene).
A piston capped with a calibrated static load (such as 2.16 kg or 5.0 kg) forces the molten polymer downward through a standardized capillary die conforming to ASTM D1238 dimensions. The extruded strand is cut at timed intervals, weighed on an analytical balance, and converted to the standard 10-minute value.
From a mechanical standpoint, an MFI apparatus functions as a simplified capillary rheometer where a static dead load drives the piston instead of a motorized drive with controlled piston velocity. This configuration allows operators to calculate approximate shear rate and shear stress from the measured extrusion rate and applied load.
Practical Role on the Shop Floor
MFI acts as an uncompromising gatekeeper for receiving docks. Because the speed of extrusion through the die correlates inversely with average molecular chain length, MFI provides immediate verification of whether an incoming railcar or gaylord of resin matches supplier specifications.
While academic research teams sometimes dismiss MFI as an oversimplified, single-point check, we view it as an essential front-line tool. The apparatus costs roughly ten times less than a dedicated capillary rheometer and requires far less specialized training. It is not built to replace full-spectrum rheological analysis, but for swift, repeatable raw material qualification, it remains an industry staple.
What Is Viscosity?
Viscosity is a fundamental physical property that defines a fluid’s internal friction: specifically, how much the internal layers of a substance resist sliding past one another under an applied force:
Viscosity = Shear Stress / Shear Rate
Standardized by ASTM D2196, ISO 2555, ISO 3219, and ASTM D445, viscosity is typically quantified in centipoise (cP), milliPascal-seconds (mPa·s), or Pascal-seconds (Pa·s). Measurement hardware spans benchtop rotational viscometers (such as our digital ToronVisc™ Series), cone-and-plate instruments, and high-temperature thermal units. Academic literature also evaluates micro-channel fluid devices for specialized small-volume testing.
Flow Behavior Under Shear
Standard Newtonian fluids, like water or calibration silicone standards, maintain consistent internal resistance regardless of agitation. Molten polymers, industrial resins, and adhesives, however, are distinctly non-Newtonian and shear-thinning (pseudoplastic).
When resting in a holding tank, their long polymer chains stay coiled and tangled, offering high resistance to motion. But when forced through a narrow gate or nozzle at speed, those molecular chains align in the direction of flow, dropping the material's apparent thickness dramatically.
Measuring viscosity across multiple rotational speeds yields a full rheological curve. For low-to-medium viscosity fluids and standard quality checks, entry-level rotational setups like the ToronVisc™ E-Series or touchscreen models like the ToronVisc™ S-Series capture this behavior with straightforward Brookfield-style compatibility. In research and specialized fluid characterization, systems evaluate direct fluid viscosity across varied shear regimes down to micro-volume samples (10 to 500 µL) without solvent evaporation.
While setting up a viscometer requires closer attention to spindle selection and thermal control than running an extrusion plastometer, the operational visibility it provides across varying shear rates is indispensable.
The Inverse Relationship: MFI vs Viscosity
When comparing MFI vs viscosity, their connection is fundamentally an inverse correlation:
High MFI indicates Low Viscosity: The polymer melt moves swiftly through the orifice. Shorter molecular chains present lower internal friction, meaning apparent viscosity drops sharply under standard test loads. These grades suit high-speed, thin-wall injection applications where cavities must fill within fractions of a second.
Low MFI indicates High Viscosity: The material moves sluggishly and resists displacement. Long, intertwined polymer chains provide substantial melt strength, which prevents sagging in heavy pipe extrusion or blow-molded containers.
However, this high viscosity demands significantly higher electrical draw from the drive motor and creates elevated die-head pressures during production extrusion. Viscosity also changes inversely with temperature and pressure, which shows up clearly as an increase in MFI when barrel temperatures or test weights climb.
Limitations of Direct Conversion
Quality assurance teams often look for a universal mathematical formula to convert an MFI number directly into a viscosity value. While narrow empirical approximations exist for specific resin grades under restricted conditions, we advise against using conversion formulas for commercial quality control. The calculation breaks down for three specific reasons:
- Shear-Thinning Discrepancies: An MFI test evaluates flow at low shear rates. Viscometers measure flow resistance under precise, adjustable shear rates. Two polymers with identical MFI values can shear-thin at completely different rates during high-speed production.
- Die Entrance Effects: Polymer funneling into an MFI die experiences significant extensional elongation, whereas rotational viscometers isolate pure shear stress.
- Molecular Weight Distribution (MWD): Highly branched polymers behave differently under stress compared to linear structures of identical molecular weight, invalidating standard cross-calculations.
Technical Note: Estimating Single-Point Apparent Viscosity
Engineers can estimate single-point apparent viscosity by combining standard ASTM D1238 die dimensions (2.095 mm bore, 8.000 mm length) with barrel load and MVR. Because this method omits Bagley and Rabinowitsch corrections, values run 20% to 30% higher than capillary rheometer data: useful for processing guidance, but never for certification.
Deriving Viscosity Curves from MFI
Because procuring a high-pressure capillary rheometer requires significant capital, researchers and production facilities frequently extract full viscosity curves directly from multi-weight MFI test data.
Each MFI test at a specific dead-weight load yields a single shear stress and shear rate data point. Running a series of varied loads creates a curve that spans shear rates from 10 to 1000 s⁻¹, largely covering the shear rate range found in commercial polymer extrusion lines.
| Derivation Method | Key Technical Feature | Operational Limitation |
|---|---|---|
| Two-point MFI + Flow Model | Fast to execute; yields analytical equations for extrusion issues. | Overestimates viscosity by roughly 20% to 30% compared to capillary rheometry. |
| Multi-load MFI + Cross-WLF | Generates full viscosity curves across shear rates for mold-filling simulation. | Does not integrate standard Bagley or Rabinowitsch end-corrections. |
| MFI + Numerical Simulation | Iterative computer calibration minimizes injection pressure prediction discrepancies. | Requires dedicated simulation modeling software and optimization platforms. |
| Master Curve (Shenoy Method) | Normalizes viscosity and shear rate data using standard MFI values across polymer grades. | Demands substantial baseline experimental datasets when evaluating novel polymers. |
Measurement Accuracy and Trade-Offs
Engineering teams must account for systematic discrepancies when using MFI data to estimate viscosity. Raw MFI-derived viscosity calculations are typically 20% to 30% higher than reference values generated by high-pressure capillary rheometers (HPCR).
This gap occurs because the standard MFI die has a very short capillary length-to-diameter ratio, and standard calculations omit the Bagley correction for die entrance pressure drops. Applying the Rabinowitsch correction narrows this variance, but does not eliminate it completely.
Even with these systematic offsets, experimental studies confirm that multi-load MFI testing reflects shear-thinning pseudoplasticity with dependable consistency. Predictive viscosity equations developed from MFI tester data for Carbonyl Iron Powder and HDPE mixtures achieved errors under 4% across diverse powder concentrations and temperatures.
In numerical mold-filling studies using PA6GF30, Cross-WLF curves derived from MFI data aligned closely with capillary rheometer benchmarks, showing peak injection pressure simulation errors of only 0.2%. Similarly, curve-fitting evaluations across unfilled polypropylene and glass-fiber reinforced PP exhibited errors under 18% and 5% respectively when compared to capillary rheometer data.
For compounding facilities processing filled polymers and custom composites whose properties are absent from commercial software databases, multi-load MFI derivation delivers practical, budget-conscious flow data that is accurate enough for daily engineering work.
Troubleshooting the "Identical MFI Trap"
We consider the Identical MFI Trap one of the most frustrating bottlenecks in commercial plastics manufacturing. A facility accepts a new resin shipment certified at 10 g/10 min that matches previous shipments on paper, yet causes severe flash, short shots, or excessive warpage on the line.
Consider a typical scenario found across the automotive manufacturing corridor (spanning Southern Ontario, Michigan, Ohio, and Indiana). Tier-1 suppliers molding under-the-hood components, like thirty percent glass-filled polyamide brackets, might receive two separate resin deliveries showing an identical 10 g/10 min rating on supplier quality certificates.
On paper, both shipments fulfill the technical drawing requirements. Yet, when placed into high-speed molding presses running aggressive cycle times, the second shipment flashes the mold parting line and causes dimensional rejects during audit checks.
Root Causes in High-Shear Tooling
Standard single-point MFI testing under ASTM D1238 occurs at modest shear rates (generally between 1 and 50 s⁻¹). However, industrial injection molding drives material through tiny gates and runners at shear rates reaching 10,000 to 100,000 s⁻¹.
Resin Batch A features a narrow molecular weight distribution, maintaining predictable flow resistance as injection velocity increases. In contrast, Resin Batch B possesses a broad molecular weight distribution. It yields the exact same 10 g/10 min reading under static MFI weights, but under the aggressive shear of an injection mold gate, its internal friction collapses, causing viscosity to drop sharply.
When Batch B hits the mold, it moves far more aggressively than anticipated, overcoming machine clamp tonnage, creating flash along parting lines, and throwing part dimensions out of tolerance.
Recommended Quality Protocols
When identical MFI certificates yield erratic production results, relying on a single data point leaves your team guessing. Because benchtop testing cannot replicate extreme gate shear directly, the practical operational goal is screening batches by how steeply they shear-thin under increased stress.
For solid thermoplastic resins, the fastest benchtop screen is measuring the Flow Rate Ratio (FRR). By running the same sample under both a standard load (such as 2.16 kg) and a heavy load (such as 21.6 kg) at the same temperature, technicians evaluate shear sensitivity directly on an extrusion plastometer.
A resin with a broad molecular weight distribution displays a visibly higher ratio under the heavier load, exposing the batch inconsistency using standard test hardware before material reaches the press (see our FAQ below for specific FRR details).
For liquid formulations, coatings, and reactive resins where high-shear flow governs application performance, rotational instruments provide direct rheological curves. Programmable digital units like the ToronVisc™ 79P track shear profiles across varied rotational speeds, while cone-and-plate systems like the ToronVisc™ CAP2 and CAP3 evaluate small liquid volumes under high shear rates without thermal breakdown.
Managing MFI in Recycled Polymers and PCR
Post-Consumer Recycled (PCR) flake and reground manufacturing scrap represent the most chemically variable raw materials processed in production facilities today.
Across the United States and Canada, processors balancing state and federal recycled-content mandates, such as California's SB 54, Washington State recycling requirements, or Canadian federal packaging standards, face this challenge daily. Packaging converters in major distribution hubs like the Midwest or Ontario frequently incorporate thirty to fifty percent post-consumer recycled HDPE into consumer goods bottles. Because municipal scrap bales vary by collection season, unmonitored processing shifts cause severe headaches.
Chain Scission and Melt Shifts
Each time a thermoplastic cycles through an extrusion barrel, heat and mechanical stress sever polymer backbones. As these chains break (chain scission), average molecular weights drop, sending MFI climbing while melt viscosity falls off sharply.
Alternatively, certain polyethylene grades cross-link during prolonged heat exposure, causing MFI to plummet while viscosity spikes erratically. A batch with an undetected jump in melt flow causes immediate parison sag or wall thinning during blow molding, leading to structural failures and failed drop tests.
Distinct Requirements for PET and Intrinsic Viscosity
For recycled polyethylene terephthalate (rPET) streams, the standard industry benchmark is Intrinsic Viscosity (IV), reported in deciliters per gram (dL/g) via dilute solution testing rather than standard melt flow index. Bottle-grade rPET typically requires an IV between 0.72 and 0.84 dL/g, and successive thermal processing cycles drag that number down through hydrolytic degradation.
While an extrusion plastometer can track relative batch-to-batch degradation shifts in an rPET facility, it does not yield the certified IV figure required by preform and bottle converter specifications.
Blend Ratio Control
Compounding facilities blending virgin pellets with recycled scrap must track melt flow variation closely. Unchecked fluctuations throw off product wall thicknesses and parison stability on continuous lines.
We believe that reliable melt flow verification is essential for modern recycling operations. While portable tools like the ToronVisc™ PDV Series allow technicians to run real-time viscosity checks directly on liquid additives or slurries at the receiving dock, benchtop plastometers verify incoming scrap bales and re-pelletized lots.
This enables compounders to adjust blend ratios proactively, keeping final compounded material within strict processing tolerances.
Application Guide: MFI vs. Viscosity
Selecting between an extrusion plastometer and a viscometer comes down to material form, processing environment, and primary testing objectives:
Solid Thermoplastics and Inbound Quality Control
Deploy an extrusion plastometer when qualifying solid thermoplastics such as virgin resin pellets, regrind flakes, or compounded masterbatches. It provides the rapid material clearance required to approve or reject bulk truck, railcar, or gaylord deliveries against supplier Certificates of Analysis (COA). If your quality operations focus on monitoring batch variation in post-consumer materials or strictly meeting ASTM D1238 and ISO 1133 methods, an MFI tester is the primary tool for the bench.
Fluid Rheology and Shear-Thinning Formulations
Deploy a rotational or cone-and-plate viscometer when evaluating liquids, pastes, or reactive materials such as industrial adhesives, coatings, liquid epoxies, silicone formulations, and hot-melt resins. These instruments allow formulators to simulate pumping resistance, spray atomization, roller application, and mold cavity filling across a broad range of controlled shear rates. They are also necessary for tracking setting times and chemical curing reactions in accordance with ASTM D2196, ISO 2555, or ISO 3219.
High-Temperature Binders and Melts
Formulations like asphalt pitch, paraffin wax, hot-melt glues, and molten polymers require specialized thermal chambers. For instance, in civil road-building programs governed by AASHTO or provincial transportation ministry specifications across northern states and Canadian provinces, binders must endure winter cracking and summer rutting. Specialized systems like the ToronVisc™ AI250 / AI500 or all-in-one units like the ToronVisc™ T3 / T4 maintain precise sample heat up to elevated limits, especially when supported by external units like ToronCool™ Thermostatic Circulation Tanks.
MFI Test Selection: Method A vs. Method B
Once you establish that melt flow testing matches your quality assurance workflow, you must select the appropriate instrument configuration:
Method A: Manual Mass-Cut
Under Method A, the operator uses a manual or timed cutting mechanism to slice extruded polymer strands at precise intervals (such as every 30 or 60 seconds). The strands are collected, weighed on an analytical balance, and the mass is mathematically converted into grams per 10 minutes.
This approach is ideal for moderate testing volumes and raw material qualification, covering the 0.15 to 50 g/10 min range that ASTM D1238 assigns to Procedure A. Tabletop units like our ToronMFI™-A deliver dependable, budget-conscious testing across an expansive 0.1 to 100 g/10 min operating window for facilities that do not require continuous high-throughput measurement.
Method B: Automated Displacement
Procedure B tracks piston displacement electronically over a calibrated measurement distance. By combining displacement distance and travel time with barrel geometry and melt density, the unit calculates Melt Volume Rate (MVR) automatically, converting it to MFR without requiring manual cuts or analytical weighing.
Procedure B covers materials flowing from 0.50 up to approximately 1,500 g/10 min under ASTM D1238. It becomes the practical choice for high-volume laboratories, fast-flowing resins whose extrudate drops too swiftly for manual cutting, and strict ISO 1133 compliance. Consider processing facilities receiving bulk 180,000 to 200,000-pound railcar deliveries directly from petrochemical producers in Texas, Louisiana, or Alberta: using manual cut methods on rail sidings creates an operational bottleneck, whereas automated displacement clears incoming lots swiftly.
Within this category, dual-capability tabletop instruments like our ToronMFI™-B and systems built for complex materials like our ToronMFI™-D cut test durations in half while logging digital records for audit trails. Additionally, the tablet-controlled ToronMFI™-V runs displacement-based MVR testing and reports MFR, MVR, melt density, apparent viscosity, shear stress, and shear rate from a single test run, bridging routine quality checks with the apparent flow modeling discussed earlier.
Total Cost of Ownership and Lab Budgeting
Procuring materials testing hardware often forces managers toward an unnecessary compromise: pay an inflated brand markup for legacy suppliers, or risk purchasing uncertified entry-level units that fail audit standards. High-pressure capillary rheometers can easily exceed equipment budgets by a factor of ten.
We have long maintained that paying an excessive brand premium on legacy equipment does not yield better repeatability or tighter standards compliance. Torontech was built to challenge these conventional price-to-performance benchmarks by delivering cost-effective technologies that meet strict international testing standards.
Primary Testing Cost Drivers
When calculating the true lifecycle cost of an instrument, we encourage quality managers to evaluate three distinct components:
- Initial Equipment CapEx: Premium brand markups tie up capital that could otherwise support multiple inspection stations or plant upgrades.
- Consumables and Tooling Wear: Test dies, calibrated measurement springs, and spindles wear down over time. Overpriced proprietary replacement parts steadily erode annual maintenance budgets.
- Calibration and Service Dependency: Equipment requiring proprietary factory technicians for routine recalibration drives up long-term service costs over a five-to-ten-year horizon.
Capital Efficiency and Practical Alternatives
Sensible testing equipment pairs strict budget discipline with reliable, high-precision engineering. Selecting systems built around accessible standard components, responsive digital controls, and verified compliance with ASTM D1238 and ASTM D2196 provides laboratories with dependable data at a practical price point. Lower capital expenditures lead to faster payback periods, whether outfitting a single quality station or standardizing testing across multiple regional plants.
Cost-Effective Flow Testing Gear from Torontech
Choosing between MFI and viscosity comes down to your analytical scope: MFI indexers deliver rapid pass/fail screening for raw thermoplastic lots and recycling streams, while viscometers map complete flow curves across varying shear rates and temperatures.
At Torontech, we deliver cost-effective solutions and innovative technologies that ensure full ASTM and ISO compliance without legacy brand markups.
- Extrusion Plastometers: The ToronMFI™ Series offers ASTM D1238 and ISO 1133 testing ranging from manual Method A units to automated Method B systems.
- Rotational Viscometers: The ToronVisc™ Series covers digital rotational, high-temperature, and cone-and-plate geometries conforming to ASTM D2196 and ISO 2555.
Need to verify equipment specifications or request pricing? Contact our technical engineering team today for an application consultation or a direct quotation for your quality testing operations.
References (Click to expand)
- Bankar, P., & Reddy, M. S. (2021). Analysis on Different Types of Viscometers, Design, Materials, and Technology: A Review. Lecture Notes in Mechanical Engineering, 47.
- Doifode, D. S., Deorukhkar, B. D., Date, P., & Alexandrov, S. (2018). Rheological Behavior of Mixture of Carbonyl Iron Powder (CIP) and High Density Polyethylene (HDPE). Key Engineering Materials, 779, 31-36.
- Gupta, S., Wang, W. S., & Vanapalli, S. (2016). Microfluidic viscometers for shear rheology of complex fluids and biofluids. Biomicrofluidics, 10(4), 043402.
- Kang, Y., Yoon, S. Y., Lee, K.-H., & Yang, S. (2010). A highly accurate and consistent microfluidic viscometer for continuous blood viscosity measurement. Artificial Organs, 34(11), 944-949.
- Kapadia, W., Giri, N. V., Qin, N., Zhao, P., Phan, C., Haines, L., Jones, L., & Ren, C. L. (2025). A novel microfluidic viscometer for measuring viscosity of ultrasmall volumes of Newtonian and non-Newtonian liquids. Journal of Micromechanics and Microengineering, 35.
- Lee, T., Liao, W.-H., Wu, Y.-F., Chen, Y.-L., & Tung, Y. (2018). Electrofluidic Circuit-Based Microfluidic Viscometer for Analysis of Newtonian and Non-Newtonian Liquids under Different Temperatures. Analytical Chemistry, 90(3), 2317-2325.
- Liu, L., Hu, D., & Lam, R. H. W. (2020). Microfluidic Viscometer Using a Suspending Micromembrane for Measurement of Biosamples. Micromachines, 11(10), 934.
- Oubellaouch, K. (2024). A melt flow index-based approach for the viscosity curves determination. Materials Research Proceedings, 298.
- Oubellaouch, K., Pelaccia, R., Orazi, L., Pozzi, P., Carmignato, S., Bonato, N., Donati, L., Raimondi, L., & Reggiani, B. (2025). A novel experimental–numerical procedure for the rheological characterization of thermoplastic polymers applied to injection molding. The International Journal of Advanced Manufacturing Technology, 140, 5419-5433.
- Shenoy, A., Saini, D., & Nadkarni, V. M. (1982). Rheograms of cellulosic polymers from the melt flow index. Journal of Applied Polymer Science, 27, 4399-4408.
- Singh, P., Sharma, A., Puchades, V., & Agarwal, P. (2022). A Comprehensive Review on MEMS-based Viscometers. Sensors and Actuators A: Physical, 113456.
- Solomon, D. E., & Vanapalli, S. (2014). Multiplexed microfluidic viscometer for high-throughput complex fluid rheology. Microfluidics and Nanofluidics, 16, 677-690.
- Vilimi, Z., Pápay, Z., Basa, B., Orekhova, X., Kállai-Szabó, N., & Antal, I. (2024). Microfluidic Rheology: An Innovative Method for Viscosity Measurement of Gels and Various Pharmaceuticals. Gels, 10(7), 464.
- Wilczyński, K., Buziak, K., Lewandowski, A., & Wilczyński, K. (2025). Rheology for Wood Plastic Composite Extrusion—Part 1: Laboratory vs. On-Line Rheometry. Polymers, 17(20), 2782.
- Wilczyński, K., Buziak, K., Nastaj, A., Lewandowski, A., & Wilczyński, K. (2026). Rheology for Wood Plastic Composite Extrusion Part 2: Process Simulation and Experimental Verification. Polymers, 18(6), 0744.
- Younes, B. (2015). Simple Rheological Analysis Method of Spinnable-Polymer Flow Properties Using MFI Tester. Indian Journal of Materials Science, 2015, 1-8.
- Yu, Y., Xi, L., Yao, M., Liu, L., Zhang, Y., Huo, S., Fang, Z.-Z., & Song, P. (2022). Governing effects of melt viscosity on fire performances of polylactide and its fire-retardant systems. iScience, 25(3), 103950.